Subpart (a):
The impact of technological advancement on TV production.
Subpart (a):
Explanation of Solution
When the technological advancement in production reduces the world price of televisions, the impact on the importer will be as follows: the importing price will fall, which will reduce the domestic price for televisions; this will increase the
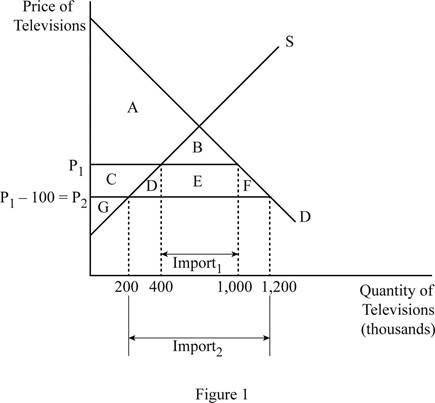
The world price was initially P1, where the consumer surplus was the area of A+B, producer surplus was the area of C+G and the total surplus was the area of A+B+C+G. The quantity of televisions imported is denoted by the Import1 on the graph. When the world price falls to P2 (P1 - 100), the consumer surplus increases to the area of A+B+C+D+E+F, which means that the consumer surplus increases by the area of C+D+E+F. The producer surplus becomes the area of G only which means that the producer surplus declined by the area of C. Thus, the total surplus becomes the area of A+B+C+D+E+F+G which means that the total surplus in the economy increased by the area of D+E+F. As a result of the lower price, the domestic supply falls and the demand increases; this means that the imports increase to Import2, as shown on the graph. The changes can be tabulated as follows:
| P1 | P2 | CHANGE | |
| Consumer Surplus | A + B | A + B + C + D + E + F | C + D + E + F |
| Producer Surplus | C + G | G | –C |
| Total Surplus | A + B + C + G | A + B + C + D + E + F + G | D + E + F |
Concept introduction:
International trade: It is the trade relation between the countries.
Export: It is the process of selling domestic goods in the international market. Thus, the goods produced in the domestic firms will be sold to other foreign countries. So, it is the outflow of domestic goods and services to the foreign economy.
Import: It is the process of purchasing the foreign-made goods and services by the domestic country. Thus, it is the inflow of foreign goods and services to the domestic economy.
Subpart (b):
The impact of technological advancement on TV production.
Subpart (b):
Explanation of Solution
The area of C can be calculated as follows:
Area of C is $30 million.
The area of D can be calculated as follows:
Area of D is $10 million.
The area of E can be calculated as follows:
Area of E is $60 million.
The area of F can be calculated as follows:
Area of F is $10 million.
The change in the consumer surplus is by the area of C+D+E+F. Thus, the value of change in consumer surplus can be calculated as follows:
Thus, the value of change in consumer surplus is by $110 million.
The change in the producer surplus is by the area of - C. Thus, the value of change in producer surplus is by $30 million.
The change in the total surplus is by the area of D+E+F. Thus, the value of change in total surplus can be calculated as follows:
Thus, the value of change in total surplus is by $80 million.
Concept introduction:
International trade: It is the trade relation between the countries.
Export: It is the process of selling domestic goods in the international market. Thus, the goods produced in the domestic firms will be sold to other foreign countries. So, it is the outflow of domestic goods and services to the foreign economy.
Import: It is the process of purchasing the foreign-made goods and services by the domestic country. Thus, it is the inflow of foreign goods and services to the domestic economy.
Comparative advantage: It is the ability of the country to produce the goods and services at lower opportunity costs than the other countries.
Subpart (c):
The impact of technological advancement on TV production.
Subpart (c):
Explanation of Solution
When the government imposes a tax of $100 on the imports, the price of the imports will increase by $100; this means that the price level will revert back to the initial world price. This denotes that the consumer surplus, producer surplus, and the total surplus will revert back to the initial levels. The consumer surplus will fall by the area of C+D+E+F, which is $110 million and the producer surplus will increase by the area of C, which is $30 million.
The government would earn a tax revenue through this and the tax revenue can be calculated as follows:
Thus, the government will earn a tax revenue of $60 million.
There will be
Concept introduction:
International trade: It is the trade relation between the countries.
Export: It is the process of selling domestic goods in the international market. Thus, the goods produced in the domestic firms will be sold to other foreign countries. So, it is the outflow of domestic goods and services to the foreign economy.
Import: It is the process of purchasing the foreign-made goods and services by the domestic country. Thus, it is the inflow of foreign goods and services to the domestic economy.
Comparative advantage: It is the ability of the country to produce the goods and services at lower opportunity costs than the other countries.
Subpart (d):
The impact of technological advancement on TV production.
Subpart (d):
Explanation of Solution
The fall in the world price benefits the consumers because they are able to get the commodity at lower price than before. Also, the consumer surplus increases by $110 million. The fall in the world price harms the domestic producers because it leads to a fall in the producer surplus by $30 million. Since the consumer is benefited much more than the producer is harmed, the total welfare of the economy increases. Thus, the reason behind the fall in the world price does not matter in the analysis.
Concept introduction:
International trade: It is the trade relation between the countries.
Export: It is the process of selling domestic goods in the international market. Thus, the goods produced in the domestic firms will be sold to other foreign countries. So, it is the outflow of domestic goods and services to the foreign economy.
Import: It is the process of purchasing the foreign-made goods and services by the domestic country. Thus, it is the inflow of foreign goods and services to the domestic economy.
Comparative advantage: It is the ability of the country to produce the goods and services at lower opportunity costs than the other countries.
Want to see more full solutions like this?
Chapter 9 Solutions
Bundle: Principles of Economics, Loose-leaf Version, 8th + LMS Integrated MindTap Economics, 2 terms (12 months) Printed Access Card

- 3. Distinguish between a direct democracy and a representative democracy. Use appropriate examples to support your answers. [4] 4. Explain the distinction between outputs and outcomes in social service delivery [2] 5. A R1000 tax payable by all adults could be viewed as both a proportional tax and a regressive tax. Do you agree? Explain. [4] 6. Briefly explain the displacement effect in Peacock and Wiseman's model of government expenditure growth and provide a relevant example of it in the South African context. [5] 7. Explain how unbalanced productivity growth may affect government expenditure and briefly comment on its relevance to South Africa. [5] 8. South Africa has recently proposed an increase in its value-added tax rate to 15%, sparking much controversy. Why is it argued that value-added tax is inequitable and what can be done to correct the inequity? [5] 9. Briefly explain the difference between access to education and the quality of education, and why we should care about the…arrow_forward20. Factors 01 pro B. the technological innovations available to companies. A. the laws that regulate manufacturers. C. the resources used to create output D. the waste left over after goods are produced. 21. Table 1.1 shows the tradeoff between different combinations of missile production and home construction, ceteris paribus. Complete the table by calculating the required opportunity costs for both missiles and houses. Then answer the indicated question(s). Combination Number of houses Opportunity cost of houses in Number of missiles terms of missiles J 0 4 K 10,000 3 L 17,000 2 1 M 21,000 0 N 23,000 Opportunity cost of missiles in terms of houses Tutorials-Principles of Economics m health carearrow_forwardIn a small open economy with a floating exchange rate, the supply of real money balances is fixed and a rise in government spending ______ Group of answer choices Raises the interest rate so that net exports must fall to maintain equilibrium in the goods market. Cannot change the interest rate so that net exports must fall to maintain equilibrium in the goods market. Cannot change the interest rate so income must rise to maintain equilibrium in the money market Raises the interest rate, so that income must rise to maintain equilibrium in the money market.arrow_forward
- Suppose a country with a fixed exchange rate decides to implement a devaluation of its currency and commits to maintaining the new fixed parity. This implies (A) ______________ in the demand for its goods and a monetary (B) _______________. Group of answer choices (A) expansion ; (B) contraction (A) contraction ; (B) expansion (A) expansion ; (B) expansion (A) contraction ; (B) contractionarrow_forwardAssume a small open country under fixed exchanges rate and full capital mobility. Prices are fixed in the short run and equilibrium is given initially at point A. An exogenous increase in public spending shifts the IS curve to IS'. Which of the following statements is true? Group of answer choices A new equilibrium is reached at point B. The TR curve will shift down until it passes through point B. A new equilibrium is reached at point C. Point B can only be reached in the absence of capital mobility.arrow_forwardA decrease in money demand causes the real interest rate to _____ and output to _____ in the short run, before prices adjust to restore equilibrium. Group of answer choices rise; rise fall; fall fall; rise rise; fallarrow_forward
- If a country's policy makers were to continously use expansionary monetary policy in an attempt to hold unemployment below the natural rate , the long urn result would be? Group of answer choices a decrease in the unemployment rate an increase in the level of output All of these an increase in the rate of inflationarrow_forwardA shift in the Aggregate Supply curve to the right will result in a move to a point that is southwest of where the economy is currently at. Group of answer choices True Falsearrow_forwardAn oil shock can cause stagflation, a period of higher inflation and higher unemployment. When this happens, the economy moves to a point to the northeast of where it currently is. After the economy has moved to the northeast, the Federal Reserve can reduce that inflation without having to worry about causing more unemployment. Group of answer choices True Falsearrow_forward
- The long-run Phillips Curve is vertical which indicates Group of answer choices that in the long-run, there is no tradeoff between inflation and unemployment. that in the long-run, there is no tradeoff between inflation and the price level. None of these that in the long-run, the economy returns to a 4 percent level of inflation.arrow_forwardSuppose the exchange rate between the British pound and the U.S. dollar is £1 = $2.00. The U.S. government implementsU.S. government implements a contractionary fiscal policya contractionary fiscal policy. Illustrate the impact of this change in the market for pounds. 1.) Using the line drawing tool, draw and label a new demand line. 2.) Using the line drawing tool, draw and label a new supply line. Note: Carefully follow the instructions above and only draw the required objects.arrow_forwardJust Part D please, this is for environmental economicsarrow_forward
 Principles of Macroeconomics (MindTap Course List)EconomicsISBN:9781285165912Author:N. Gregory MankiwPublisher:Cengage Learning
 Principles of Economics, 7th Edition (MindTap Cou...EconomicsISBN:9781285165875Author:N. Gregory MankiwPublisher:Cengage Learning
 Essentials of Economics (MindTap Course List)EconomicsISBN:9781337091992Author:N. Gregory MankiwPublisher:Cengage Learning
 Principles of MicroeconomicsEconomicsISBN:9781305156050Author:N. Gregory MankiwPublisher:Cengage Learning
 Principles of Economics (MindTap Course List)EconomicsISBN:9781305585126Author:N. Gregory MankiwPublisher:Cengage Learning
 Principles of Microeconomics (MindTap Course List)EconomicsISBN:9781305971493Author:N. Gregory MankiwPublisher:Cengage Learning