
Concept explainers
Videos
For each exercise, perform these steps. Assume that all variables are normally or approximately
a. State the hypotheses and identify the claim.
b. Find the critical value(s).
c. Compute the test value.
d. Make the decision.
e. Summarize the results.
Use the traditional method of hypothesis testing unless otherwise specified.
5. Teachers’ Salaries A random sample of 15 teachers from Rhode Island has an average salary of $35,270, with a standard deviation of $3256. A random sample of 30 teachers from New York has an average salary of $29,512, with a standard deviation of $1432. Is there a significant difference in teachers’ salaries between the two states? Use α = 0.02. Find the 98% confidence interval for the difference of the two
a.
To identify: The claim and state
Answer to Problem 9.2.5RE
The claim is that “there is a significant difference in teachers’ salaries between the two states”.
The hypotheses are given below:
Null hypothesis:
Alternative hypothesis:
Explanation of Solution
Given info:
Justification:
Here, there is a significant difference in teachers’ salaries between the two states is tested. Hence, the claim is that there is a significant difference in teachers’ salaries between the two states. This can be written as
The hypotheses are given below:
Null hypothesis:
Alternative hypothesis:
b.
To find: The critical value
Answer to Problem 9.2.5RE
The critical value at
Explanation of Solution
Calculation:
Here, the test is two tailed test.
Critical value:
Here, variances are not equal. Hence, the degrees of freedom is,
Software Procedure:
Step-by-step procedure to obtain the critical value using the MINITAB software:
- Choose Graph > Probability Distribution Plot choose View Probability> OK.
- From Distribution, choose ‘t’ distribution.
- In Degrees of freedom, enter 14.
- Click the Shaded Area tab.
- Choose Probability value and Two Tail for the region of the curve to shade.
- Enter the Probability value as 0.02.
- Click OK.
Output using the MINITAB software is given below:
From the output, the critical value is
c.
To find: The test value.
To find: The 98% confidence interval for the difference of the two means.
Answer to Problem 9.2.5RE
The test value is –0.9.
The 98% confidence interval for the difference of the two means is
Explanation of Solution
Calculation:
Test statistic:
Software Procedure:
Step by step procedure to obtain test statistic using the MINITAB software:
- Choose Stat > Basic Statistics > 2-Sample t.
- Choose Summarized data.
- In first, enter Sample size as15, Mean as 35,270, Standard deviation as 3,256.
- In second, enter Sample size as30, Mean as 29,512, Standard deviation as 1,432.
- Choose Options.
- In Confidence level, enter 98.
- In Alternative, select not equal.
- Click OK in all the dialogue boxes.
Output using the MINITAB software is given below:
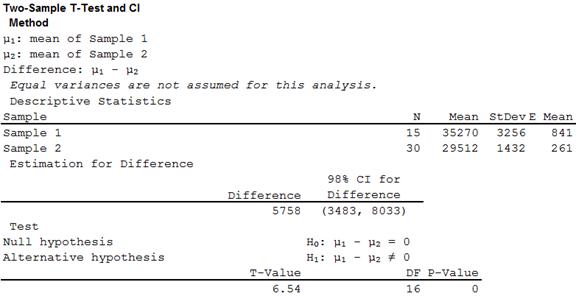
From the MINITAB output, the test value is 6.54 and the 98% confidence interval for the difference of the two means is
d.
To make: The decision.
Answer to Problem 9.2.5RE
The decision is that, the null hypothesis isrejected.
Explanation of Solution
Calculation:
Software Procedure:
Step-by-step procedure to indicate the appropriate area and critical value using the MINITAB software:
- Choose Graph > Probability Distribution Plot choose View Probability> OK.
- From Distribution, choose ‘t’ distribution.
- In Degrees of freedom, enter 8.
- Click the Shaded Area tab.
- Choose Probability value and Two Tail for the region of the curve to shade.
- Enter the Probability value as 0.02.
- Enter 6.54 under show reference lines at X values
- Click OK.
Output using the MINITAB software is given below:
From the output, it can be observed that the test statistic value falls in the critical region. Therefore, the null hypothesis isrejected.
e.
To summarize: The result.
Answer to Problem 9.2.5RE
The conclusion is that, there is enough evidence to support the claim that there is a significant difference in teachers’ salaries between the two states.
Explanation of Solution
Justification:
From part (d), the null hypothesis is rejected. Thus, there is enough evidence to support the claim that there is a significant difference in teachers’ salaries between the two states.
Want to see more full solutions like this?
Chapter 9 Solutions
Elementary Statistics: A Step By Step Approach


- 310015 K Question 9, 5.2.28-T Part 1 of 4 HW Score: 85.96%, 49 of 57 points Points: 1 Save of 6 Based on a poll, among adults who regret getting tattoos, 28% say that they were too young when they got their tattoos. Assume that six adults who regret getting tattoos are randomly selected, and find the indicated probability. Complete parts (a) through (d) below. a. Find the probability that none of the selected adults say that they were too young to get tattoos. 0.0520 (Round to four decimal places as needed.) Clear all Final check Feb 7 12:47 US Oarrow_forwardhow could the bar graph have been organized differently to make it easier to compare opinion changes within political partiesarrow_forwardDraw a picture of a normal distribution with mean 70 and standard deviation 5.arrow_forward
- What do you guess are the standard deviations of the two distributions in the previous example problem?arrow_forwardPlease answer the questionsarrow_forward30. An individual who has automobile insurance from a certain company is randomly selected. Let Y be the num- ber of moving violations for which the individual was cited during the last 3 years. The pmf of Y isy | 1 2 4 8 16p(y) | .05 .10 .35 .40 .10 a.Compute E(Y).b. Suppose an individual with Y violations incurs a surcharge of $100Y^2. Calculate the expected amount of the surcharge.arrow_forward
- 24. An insurance company offers its policyholders a num- ber of different premium payment options. For a ran- domly selected policyholder, let X = the number of months between successive payments. The cdf of X is as follows: F(x)=0.00 : x < 10.30 : 1≤x<30.40 : 3≤ x < 40.45 : 4≤ x <60.60 : 6≤ x < 121.00 : 12≤ x a. What is the pmf of X?b. Using just the cdf, compute P(3≤ X ≤6) and P(4≤ X).arrow_forward59. At a certain gas station, 40% of the customers use regular gas (A1), 35% use plus gas (A2), and 25% use premium (A3). Of those customers using regular gas, only 30% fill their tanks (event B). Of those customers using plus, 60% fill their tanks, whereas of those using premium, 50% fill their tanks.a. What is the probability that the next customer will request plus gas and fill the tank (A2 B)?b. What is the probability that the next customer fills the tank?c. If the next customer fills the tank, what is the probability that regular gas is requested? Plus? Premium?arrow_forward38. Possible values of X, the number of components in a system submitted for repair that must be replaced, are 1, 2, 3, and 4 with corresponding probabilities .15, .35, .35, and .15, respectively. a. Calculate E(X) and then E(5 - X).b. Would the repair facility be better off charging a flat fee of $75 or else the amount $[150/(5 - X)]? [Note: It is not generally true that E(c/Y) = c/E(Y).]arrow_forward
- 74. The proportions of blood phenotypes in the U.S. popula- tion are as follows:A B AB O .40 .11 .04 .45 Assuming that the phenotypes of two randomly selected individuals are independent of one another, what is the probability that both phenotypes are O? What is the probability that the phenotypes of two randomly selected individuals match?arrow_forward53. A certain shop repairs both audio and video compo- nents. Let A denote the event that the next component brought in for repair is an audio component, and let B be the event that the next component is a compact disc player (so the event B is contained in A). Suppose that P(A) = .6 and P(B) = .05. What is P(BA)?arrow_forward26. A certain system can experience three different types of defects. Let A;(i = 1,2,3) denote the event that the sys- tem has a defect of type i. Suppose thatP(A1) = .12 P(A) = .07 P(A) = .05P(A, U A2) = .13P(A, U A3) = .14P(A2 U A3) = .10P(A, A2 A3) = .011Rshelfa. What is the probability that the system does not havea type 1 defect?b. What is the probability that the system has both type 1 and type 2 defects?c. What is the probability that the system has both type 1 and type 2 defects but not a type 3 defect? d. What is the probability that the system has at most two of these defects?arrow_forward
 College Algebra (MindTap Course List)AlgebraISBN:9781305652231Author:R. David Gustafson, Jeff HughesPublisher:Cengage Learning
 Glencoe Algebra 1, Student Edition, 9780079039897...AlgebraISBN:9780079039897Author:CarterPublisher:McGraw Hill

 Holt Mcdougal Larson Pre-algebra: Student Edition...AlgebraISBN:9780547587776Author:HOLT MCDOUGALPublisher:HOLT MCDOUGAL