
Concept explainers
Videos
For each exercise, perform these steps. Assume that all variables are normally or approximately
a. State the hypotheses and identify the claim.
b. Find the critical value(s).
c. Compute the test value.
d. Make the decision.
e. Summarize the results.
Use the traditional method of hypothesis testing unless otherwise specified.
5. Teachers’ Salaries A random sample of 15 teachers from Rhode Island has an average salary of $35,270, with a standard deviation of $3256. A random sample of 30 teachers from New York has an average salary of $29,512, with a standard deviation of $1432. Is there a significant difference in teachers’ salaries between the two states? Use α = 0.02. Find the 98% confidence interval for the difference of the two
a.
To identify: The claim and state
Answer to Problem 9.2.5RE
The claim is that “there is a significant difference in teachers’ salaries between the two states”.
The hypotheses are given below:
Null hypothesis:
Alternative hypothesis:
Explanation of Solution
Given info:
Justification:
Here, there is a significant difference in teachers’ salaries between the two states is tested. Hence, the claim is that there is a significant difference in teachers’ salaries between the two states. This can be written as
The hypotheses are given below:
Null hypothesis:
Alternative hypothesis:
b.
To find: The critical value
Answer to Problem 9.2.5RE
The critical value at
Explanation of Solution
Calculation:
Here, the test is two tailed test.
Critical value:
Here, variances are not equal. Hence, the degrees of freedom is,
Software Procedure:
Step-by-step procedure to obtain the critical value using the MINITAB software:
- Choose Graph > Probability Distribution Plot choose View Probability> OK.
- From Distribution, choose ‘t’ distribution.
- In Degrees of freedom, enter 14.
- Click the Shaded Area tab.
- Choose Probability value and Two Tail for the region of the curve to shade.
- Enter the Probability value as 0.02.
- Click OK.
Output using the MINITAB software is given below:
From the output, the critical value is
c.
To find: The test value.
To find: The 98% confidence interval for the difference of the two means.
Answer to Problem 9.2.5RE
The test value is –0.9.
The 98% confidence interval for the difference of the two means is
Explanation of Solution
Calculation:
Test statistic:
Software Procedure:
Step by step procedure to obtain test statistic using the MINITAB software:
- Choose Stat > Basic Statistics > 2-Sample t.
- Choose Summarized data.
- In first, enter Sample size as15, Mean as 35,270, Standard deviation as 3,256.
- In second, enter Sample size as30, Mean as 29,512, Standard deviation as 1,432.
- Choose Options.
- In Confidence level, enter 98.
- In Alternative, select not equal.
- Click OK in all the dialogue boxes.
Output using the MINITAB software is given below:
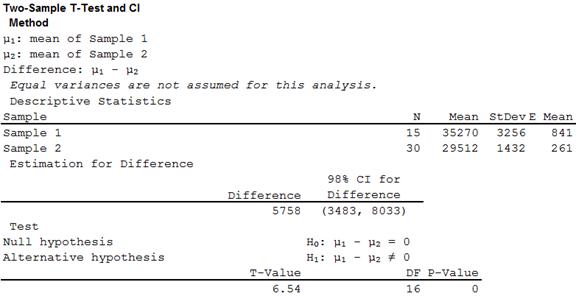
From the MINITAB output, the test value is 6.54 and the 98% confidence interval for the difference of the two means is
d.
To make: The decision.
Answer to Problem 9.2.5RE
The decision is that, the null hypothesis isrejected.
Explanation of Solution
Calculation:
Software Procedure:
Step-by-step procedure to indicate the appropriate area and critical value using the MINITAB software:
- Choose Graph > Probability Distribution Plot choose View Probability> OK.
- From Distribution, choose ‘t’ distribution.
- In Degrees of freedom, enter 8.
- Click the Shaded Area tab.
- Choose Probability value and Two Tail for the region of the curve to shade.
- Enter the Probability value as 0.02.
- Enter 6.54 under show reference lines at X values
- Click OK.
Output using the MINITAB software is given below:
From the output, it can be observed that the test statistic value falls in the critical region. Therefore, the null hypothesis isrejected.
e.
To summarize: The result.
Answer to Problem 9.2.5RE
The conclusion is that, there is enough evidence to support the claim that there is a significant difference in teachers’ salaries between the two states.
Explanation of Solution
Justification:
From part (d), the null hypothesis is rejected. Thus, there is enough evidence to support the claim that there is a significant difference in teachers’ salaries between the two states.
Want to see more full solutions like this?
Chapter 9 Solutions
ALEKS 360 ELEM STATISTICS


- solve on paperarrow_forwardsolve the question based on hw 1, 1.41arrow_forwardT1.4: Let ẞ(G) be the minimum size of a vertex cover, a(G) be the maximum size of an independent set and m(G) = |E(G)|. (i) Prove that if G is triangle free (no induced K3) then m(G) ≤ a(G)B(G). Hints - The neighborhood of a vertex in a triangle free graph must be independent; all edges have at least one end in a vertex cover. (ii) Show that all graphs of order n ≥ 3 and size m> [n2/4] contain a triangle. Hints - you may need to use either elementary calculus or the arithmetic-geometric mean inequality.arrow_forward
- We consider the one-period model studied in class as an example. Namely, we assumethat the current stock price is S0 = 10. At time T, the stock has either moved up toSt = 12 (with probability p = 0.6) or down towards St = 8 (with probability 1−p = 0.4).We consider a call option on this stock with maturity T and strike price K = 10. Theinterest rate on the money market is zero.As in class, we assume that you, as a customer, are willing to buy the call option on100 shares of stock for $120. The investor, who sold you the option, can adopt one of thefollowing strategies: Strategy 1: (seen in class) Buy 50 shares of stock and borrow $380. Strategy 2: Buy 55 shares of stock and borrow $430. Strategy 3: Buy 60 shares of stock and borrow $480. Strategy 4: Buy 40 shares of stock and borrow $280.(a) For each of strategies 2-4, describe the value of the investor’s portfolio at time 0,and at time T for each possible movement of the stock.(b) For each of strategies 2-4, does the investor have…arrow_forwardNegate the following compound statement using De Morgans's laws.arrow_forwardNegate the following compound statement using De Morgans's laws.arrow_forward
- Question 6: Negate the following compound statements, using De Morgan's laws. A) If Alberta was under water entirely then there should be no fossil of mammals.arrow_forwardNegate the following compound statement using De Morgans's laws.arrow_forwardCharacterize (with proof) all connected graphs that contain no even cycles in terms oftheir blocks.arrow_forward
- Let G be a connected graph that does not have P4 or C3 as an induced subgraph (i.e.,G is P4, C3 free). Prove that G is a complete bipartite grapharrow_forwardProve sufficiency of the condition for a graph to be bipartite that is, prove that if G hasno odd cycles then G is bipartite as follows:Assume that the statement is false and that G is an edge minimal counterexample. That is, Gsatisfies the conditions and is not bipartite but G − e is bipartite for any edge e. (Note thatthis is essentially induction, just using different terminology.) What does minimality say aboutconnectivity of G? Can G − e be disconnected? Explain why if there is an edge between twovertices in the same part of a bipartition of G − e then there is an odd cyclearrow_forwardLet G be a connected graph that does not have P4 or C4 as an induced subgraph (i.e.,G is P4, C4 free). Prove that G has a vertex adjacent to all othersarrow_forward
 College Algebra (MindTap Course List)AlgebraISBN:9781305652231Author:R. David Gustafson, Jeff HughesPublisher:Cengage Learning
 Glencoe Algebra 1, Student Edition, 9780079039897...AlgebraISBN:9780079039897Author:CarterPublisher:McGraw Hill

 Holt Mcdougal Larson Pre-algebra: Student Edition...AlgebraISBN:9780547587776Author:HOLT MCDOUGALPublisher:HOLT MCDOUGAL