Videos
Profitability metrics
The following selected data were taken from the financial statements of The O'Malley Group Inc. for December 31, 20Y5. 20Y4. and 20Y3:
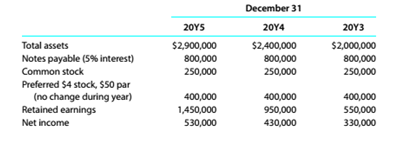
No dividends on common stock were declared between 20Y3 and 20Y5.
a.Determine the return on total assets, the return on
b. What conclusions can be drawn from these data as to the company's profitability?
(a)
Concept Introduction:
Profitability analysis:
Ithelps to evaluate the ability of a company to generate income relative to revenue, assets, operating cost and shareholders' equity during a specific period.
It measures how efficiently the resources have been utilised to generate profit.
To calculate:
Return on total assets, return on common stockholders' equity and return on stockholders' equity for the year 20Y4 and 20Y5
Explanation of Solution
| Particulars | 20Y5 | 20Y4 |
| Net income | $530,000 | $430,000 |
| Interest on Notes Payable | ||
| Preferred Dividends | $30,000 | $30,000 |
| Particulars | 20Y5 | 20Y4 |
| Common Stock (A) | $250,000 | $250,000 |
| Preferred Stock (B) | $400,000 | $400,000 |
| Retained Earnings (C) | $1,450,000 | $950,000 |
| Total Stockholders' Equity (A+B+C) | $2,100,000 | $1,600,000 |
| Total Common Stockholders' Equity (A+C) | $1,700,000 | $1,200,000 |
| Total Assets (Beginning) | $2,400,000 | $2,000,000 |
| Total Assets (Ending) | $2,900,000 | $2,400,000 |
| Total Assets (Average) | ||
| Return on Total Assets | ||
| Return on Shareholders' Equity | ||
| Return on Common Shareholders' Equity |
Retained Earnings (ending) = Retained Earnings (beginning) + Net Income − Dividends
Retained Earnings (20Y5) = Retained Earnings (20Y4) + Net Income (20Y5) − Dividends (20Y5)
$1,450,000 = $950,000 + $530,000 − Dividends (20Y5)
$1,480,000 - $1,450,000 = Dividends (20Y5)
Dividends (20Y5) = $30,000
Retained Earnings (20Y4) = Retained Earnings (20Y3) + Net Income (20Y4) − Dividends (20Y4)
$950,000 = $550,000 + $430,000 − Dividends (20Y4)
$980,000 - $950,000 = Dividends (20Y4)
Dividends (20Y4) = $30,000
(b)
Concept Introduction:
Profitability analysis:
It is used to evaluate the ability of a company to generate income relative to revenue, assets, operating cost and shareholders' equity during a specific period.
It measures how efficiently the resources have been utilised to generate profit.
To analyze:
The calculated ratios to evaluate company's profitability.
Explanation of Solution
Over the past three years company's profitability has steady increase in terms of return on total assets but a steady decline has been noticed in return on equity and return on common stock.
This is due to the earnings retained each year by the company. Though, the company is unable to utilise it to increase its profitability. Thus, the retained earnings should be utilisedaccurately to generate revenue which will in return improve the profitability of the company.
Want to see more full solutions like this?
Chapter 9 Solutions
CengageNOWv2, 1 term Printed Access Card for Warren's Survey of Accounting, 8th


- I not need ai solution please given correct answer general Accounting questionarrow_forwardThe Blue Jay Corporation has annual sales of $5,200, total debt of $1,500, total equity of $2,800, and a profit margin of 8 percent. What is the return on assets? Provide Right Answerarrow_forwardI want to this question answer general accountingarrow_forward
- What cost does cosmo manufacturing record for the new machine?arrow_forwardFinancial Accounting 5.8: Firm X and Firm Y have debt-total asset ratios of 40% and 30% and returns on total assets of 9% and 11%, respectively. What is the return on equity for Firm X and Firm Y?arrow_forwardI need this question answer general Accounting questionarrow_forward
- Bella's Florist purchased a delivery truck for $25,000. The company was given a $3,000 cash discount by the dealer and paid $1,200 sales tax. Annual insurance on the truck is $600. As a result of the purchase, by how much will Bella's Florist increase its truck account?arrow_forwardcompute the cash conversion cycle for both years.arrow_forwardAnswer? ? Financial accounting questionarrow_forward
- Financial Accounting 5.8: Firm X and Firm Y have debt-total asset ratios of 40% and 30% and returns on total assets of 9% and 11%, respectively. What is the return on equity for Firm X and Firm Y? Want answerarrow_forwardBella's Florist purchased a delivery truck for $25,000. The company was given a $3,000 cash discount by the dealer and paid $1,200 sales tax. Annual insurance on the truck is $600. As a result of the purchase, by how much will Bella's Florist increase its truck account? Answerarrow_forwardHii ticher given true answer general Accounting questionarrow_forward
 College Accounting, Chapters 1-27AccountingISBN:9781337794756Author:HEINTZ, James A.Publisher:Cengage Learning,
 Financial AccountingAccountingISBN:9781337272124Author:Carl Warren, James M. Reeve, Jonathan DuchacPublisher:Cengage Learning
 Managerial AccountingAccountingISBN:9781337912020Author:Carl Warren, Ph.d. Cma William B. TaylerPublisher:South-Western College Pub
 Financial And Managerial AccountingAccountingISBN:9781337902663Author:WARREN, Carl S.Publisher:Cengage Learning,
 Cornerstones of Financial AccountingAccountingISBN:9781337690881Author:Jay Rich, Jeff JonesPublisher:Cengage Learning
 Survey of Accounting (Accounting I)AccountingISBN:9781305961883Author:Carl WarrenPublisher:Cengage Learning