Survey of Accounting (Accounting I)
8th Edition
ISBN: 9781305961883
Author: Carl Warren
Publisher: Cengage Learning
bartleby

Videos

Textbook Question
Book Icon
Chapter 9, Problem 9.17E

Profitability metrics

The following selected data were taken from the financial statements of The O'Malley Group Inc. for December 31, 20Y5. 20Y4. and 20Y3:

Chapter 9, Problem 9.17E, Profitability metrics The following selected data were taken from the financial statements of The
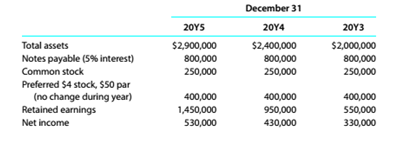
No dividends on common stock were declared between 20Y3 and 20Y5.

a.Determine the return on total assets, the return on stockholders' equity, and the return on common stockholders' equity Tor the years 20Y4 and 20Y5. Round to one decimal place.
b. What conclusions can be drawn from these data as to the company's profitability?

Expert Solution
Check Mark
To determine

(a)

Concept Introduction:

Profitability analysis:

Ithelps to evaluate the ability of a company to generate income relative to revenue, assets, operating cost and shareholders' equity during a specific period.

It measures how efficiently the resources have been utilised to generate profit.

To calculate:

Return on total assets, return on common stockholders' equity and return on stockholders' equity for the year 20Y4 and 20Y5

Explanation of Solution

  Return on total assets=net income+interest expenses Average total assets

  Return on shareholders'equity=net income-preferred dividends shareholders equity

  Return on commonstock holders equity =net income common stock holders equity

    Particulars20Y520Y4
    Net income$530,000$430,000
    Interest on Notes Payable$800,000×5%=$40,000$800,000×5%=$40,000
    Preferred Dividends$30,000$30,000
    Particulars20Y520Y4
    Common Stock (A)$250,000$250,000
    Preferred Stock (B)$400,000$400,000
    Retained Earnings (C)$1,450,000$950,000
    Total Stockholders' Equity (A+B+C)$2,100,000$1,600,000
    Total Common Stockholders' Equity (A+C)$1,700,000$1,200,000
    Total Assets (Beginning)$2,400,000$2,000,000
    Total Assets (Ending)$2,900,000$2,400,000
    Total Assets (Average)$2,900,000+$2,400,0002 =$2,650,000$2,000,000+$2,400,0002 =$2,200,000
    Return on Total Assets$530,000+$40,000$2,650,000×100=22.26%$430,000+$40,000$2,200,000×100=21.36%
    Return on Shareholders' Equity$530,000$30,000$2,100,000=23.81%$430,000$30,000$1,600,000=25%
    Return on Common Shareholders' Equity$530,000$1,700,000×100=31.18%$430,000$1,200,000×100=35.83%

Retained Earnings (ending) = Retained Earnings (beginning) + Net Income − Dividends

Retained Earnings (20Y5) = Retained Earnings (20Y4) + Net Income (20Y5) − Dividends (20Y5)

$1,450,000 = $950,000 + $530,000 − Dividends (20Y5)

$1,480,000 - $1,450,000 = Dividends (20Y5)

Dividends (20Y5) = $30,000

Retained Earnings (20Y4) = Retained Earnings (20Y3) + Net Income (20Y4) − Dividends (20Y4)

$950,000 = $550,000 + $430,000 − Dividends (20Y4)

$980,000 - $950,000 = Dividends (20Y4)

Dividends (20Y4) = $30,000

Expert Solution
Check Mark
To determine

(b)

Concept Introduction:

Profitability analysis:

It is used to evaluate the ability of a company to generate income relative to revenue, assets, operating cost and shareholders' equity during a specific period.

It measures how efficiently the resources have been utilised to generate profit.

To analyze:

The calculated ratios to evaluate company's profitability.

Explanation of Solution

Over the past three years company's profitability has steady increase in terms of return on total assets but a steady decline has been noticed in return on equity and return on common stock.

This is due to the earnings retained each year by the company. Though, the company is unable to utilise it to increase its profitability. Thus, the retained earnings should be utilisedaccurately to generate revenue which will in return improve the profitability of the company.

Want to see more full solutions like this?

Subscribe now to access step-by-step solutions to millions of textbook problems written by subject matter experts!
Students have asked these similar questions
Determine the following measures for 20Y2 (round to one decimal place, including percentages, except for per-share amounts):  Return on common stockholders' equity  Earnings per share on common stock  Price-earnings ratio  Dividends per share of common stock  Dividend yield
Profitability Ratios The following selected data were taken from the financial statements of Vidahill Inc. for December 31, 20Y7, 20Y6, and 20Y5: December 31 Total assets Notes payable (8% interest) Common stock Preferred 4% stock, $100 par (no change during year) Retained earnings 20Y7 $228,000 80,000 32,000 16,000 Return on total assets 20Y6 $205,000 80,000 32,000 16,000 89,040 48,000 The 20Y7 net income was $30,970, and the 20Y6 net income was $11,350. No dividends on common stock were declared between 20Y5 and 20Y7. Preferred dividends were declared and paid in full in 20Y6 and 20Y7. 58,710 20Y7 a. Determine the return on total assets, the return on stockholders' equity, and the return on common stockholders' equity for the years 20Y6 and 20Y7. Round percentages to one decimal place. 17.2 X % 20Y5 $182,000 80,000 32,000 16,000 12.7 X % 28.6✔ % 20Y6 Return on stockholders' equity Return on common stockholders' equity b. The profitability ratios indicate that the company's…
Measures of liquidity, solvency, and profitabilityThe comparative financial statements of Marshall Inc. are as follows. The market price of Marshall common stock was $82.60 on December 31, 20Y2. InstructionsDetermine the following measures for 20Y2 (round to one decimal place, including percentages, except for per-share amounts):1. Working capital2. Current ratio3. Quick ratio4. Accounts receivable turnover5. Number of days' sales in receivables6. Inventory turnover7. Number of days' sales in inventory8. Ratio of fixed assets to long-term liabilities9. Ratio of liabilities to stockholders' equity10. Times interest earned11. Asset turnover12. Return on total assets13. Return on stockholders' equity14. Return on common stockholders' equity15. Earnings per share on common stock16. Price-earnings ratio17. Dividends per share of common stock18. Dividend yield

Chapter 9 Solutions

Survey of Accounting (Accounting I)

Ch. 9 - For Belzcr Corporation, the working capital at the...Ch. 9 - Prob. 7CDQCh. 9 - Prob. 8CDQCh. 9 - a. Why is it advantageous to have a high inventory...Ch. 9 - Prob. 10CDQCh. 9 - Prob. 11CDQCh. 9 - Prob. 12CDQCh. 9 - Prob. 13CDQCh. 9 - Prob. 14CDQCh. 9 - Prob. 15CDQCh. 9 - Favorable business conditions may bring about...Ch. 9 - Prob. 17CDQCh. 9 - Prob. 9.1ECh. 9 - Vertical analysis of income statement The...Ch. 9 - Common-sized income statement Revenue and expense...Ch. 9 - Prob. 9.4ECh. 9 - Prob. 9.5ECh. 9 - Prob. 9.6ECh. 9 - Prob. 9.7ECh. 9 - Current position analysis The bond indenture for...Ch. 9 - Accounts receivable analysis The following data...Ch. 9 - Prob. 9.10ECh. 9 - Inventory analysis The following data were...Ch. 9 - Inventory analysis Costco Wholesale Corporation...Ch. 9 - Ratio of liabilities to stockholders' equity and...Ch. 9 - Prob. 9.14ECh. 9 - Debt ratio, ratio of liabilities to stockholders'...Ch. 9 - Prob. 9.16ECh. 9 - Profitability metrics The following selected data...Ch. 9 - Profitability metrics Macy's, Inc. (M). sells...Ch. 9 - Seven metrics The following data were taken from...Ch. 9 - Prob. 9.20ECh. 9 - Prob. 9.21ECh. 9 - Prob. 9.22ECh. 9 - Unusual income statement items Assume that the...Ch. 9 - Horizontal analysis for income statement For 20Y3....Ch. 9 - Horizontal analysis for income statement For 20Y3....Ch. 9 - Prob. 9.2.1PCh. 9 - Prob. 9.2.2PCh. 9 - Effect of transactions on current position...Ch. 9 - Effect of transactions on current position...Ch. 9 - Twenty metrics of liquidity, solvency, and...Ch. 9 - Twenty metrics of liquidity, solvency, and...Ch. 9 - Twenty metrics of liquidity, solvency, and...Ch. 9 - Twenty metrics of liquidity, solvency, and...Ch. 9 - Twenty metrics of liquidity, solvency, and...Ch. 9 - Twenty metrics of liquidity, solvency, and...Ch. 9 - Prob. 9.4.7PCh. 9 - Twenty metrics of liquidity, solvency, and...Ch. 9 - Twenty metrics of liquidity, solvency, and...Ch. 9 - Twenty metrics of liquidity, solvency, and...Ch. 9 - Twenty metrics of liquidity, solvency, and...Ch. 9 - Twenty metrics of liquidity, solvency, and...Ch. 9 - Twenty metrics of liquidity, solvency, and...Ch. 9 - Twenty metrics of liquidity, solvency, and...Ch. 9 - Twenty metrics of liquidity, solvency, and...Ch. 9 - Twenty metrics of liquidity, solvency, and...Ch. 9 - Twenty metrics of liquidity, solvency, and...Ch. 9 - Twenty metrics of liquidity, solvency, and...Ch. 9 - Twenty metrics of liquidity, solvency, and...Ch. 9 - Prob. 9.4.20PCh. 9 - Trend analysis Critelli Company has provided the...Ch. 9 - Trend analysis Critelli Company has provided the...Ch. 9 - Prob. 9.1CCh. 9 - Prob. 9.2CCh. 9 - Prob. 9.3CCh. 9 - Prob. 9.4.1CCh. 9 - Prob. 9.4.2CCh. 9 - Prob. 9.4.3CCh. 9 - Comprehensive profitability and solvency analysis...Ch. 9 - Comprehensive profitability and solvency analysis...
Knowledge Booster
Background pattern image
Accounting
Learn more about
Need a deep-dive on the concept behind this application? Look no further. Learn more about this topic, accounting and related others by exploring similar questions and additional content below.
Similar questions
SEE MORE QUESTIONS
Recommended textbooks for you
Text book image
Survey of Accounting (Accounting I)
Accounting
ISBN:9781305961883
Author:Carl Warren
Publisher:Cengage Learning
Text book image
Managerial Accounting
Accounting
ISBN:9781337912020
Author:Carl Warren, Ph.d. Cma William B. Tayler
Publisher:South-Western College Pub
Text book image
Financial And Managerial Accounting
Accounting
ISBN:9781337902663
Author:WARREN, Carl S.
Publisher:Cengage Learning,
Text book image
College Accounting, Chapters 1-27
Accounting
ISBN:9781337794756
Author:HEINTZ, James A.
Publisher:Cengage Learning,
Text book image
Managerial Accounting: The Cornerstone of Busines...
Accounting
ISBN:9781337115773
Author:Maryanne M. Mowen, Don R. Hansen, Dan L. Heitger
Publisher:Cengage Learning
Text book image
Financial Accounting
Accounting
ISBN:9781337272124
Author:Carl Warren, James M. Reeve, Jonathan Duchac
Publisher:Cengage Learning
Financial ratio analysis; Author: The Finance Storyteller;https://www.youtube.com/watch?v=MTq7HuvoGck;License: Standard Youtube License