
ELEMENTARY SATISTICS IA
13th Edition
ISBN: 9780137695522
Author: Triola
Publisher: PEARSON C
expand_more
expand_more
format_list_bulleted
Concept explainers
Videos
Textbook Question
Chapter 9, Problem 7CRE
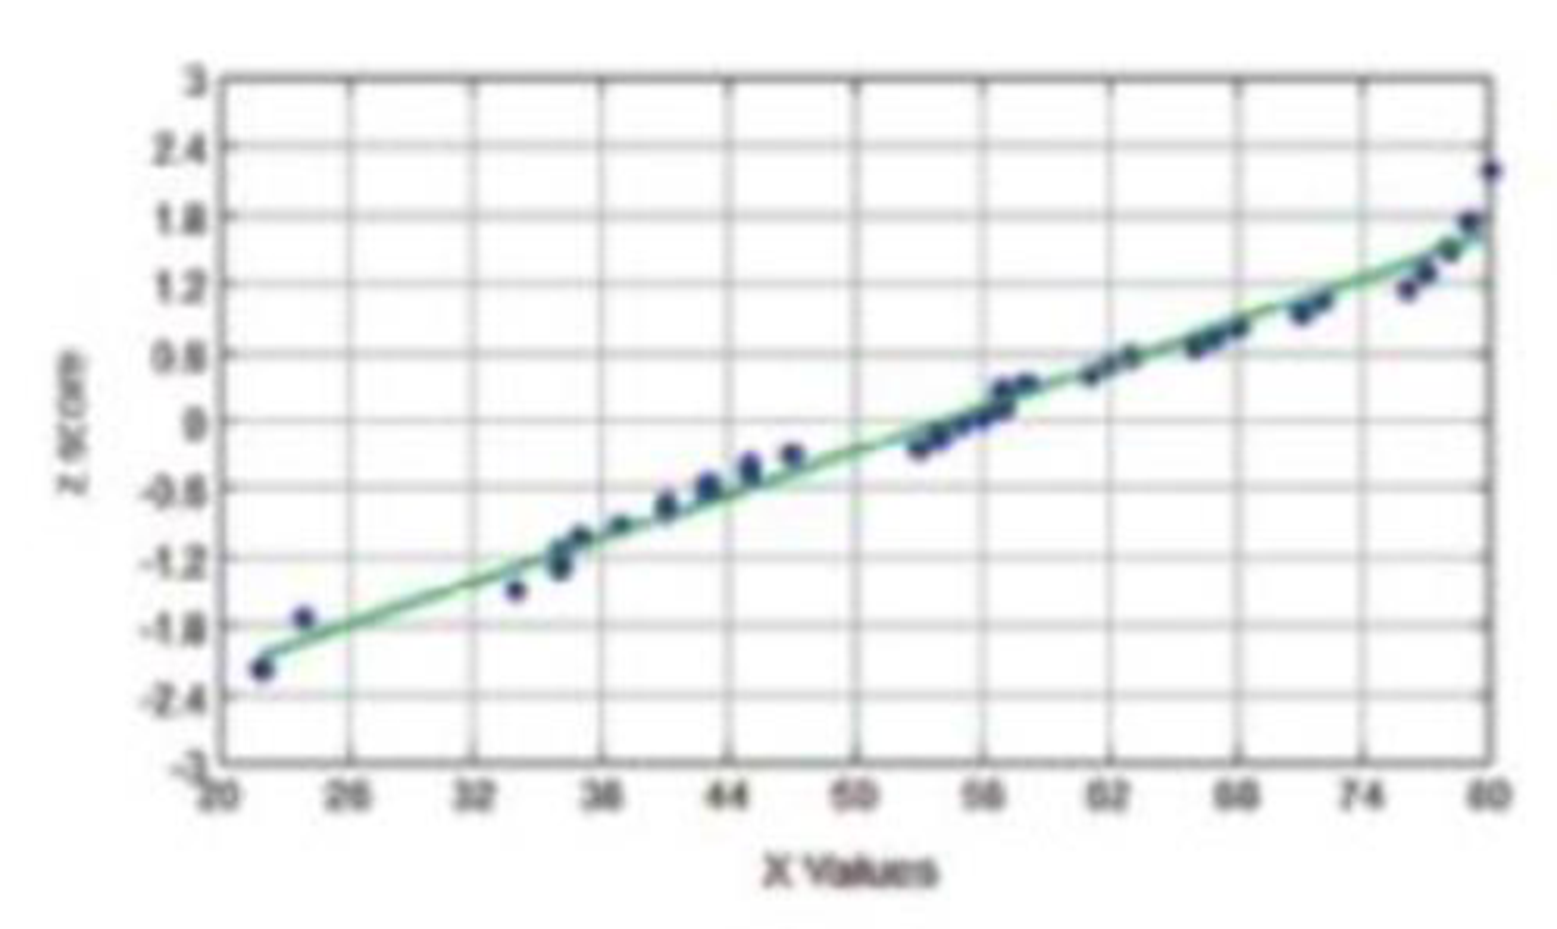
Braking Reaction Times: Normal? The accompanying normal quantile plot is obtained by using the braking reaction times of females listed in Exercise 6. Interpret this graph.
Expert Solution & Answer
Want to see the full answer?
Check out a sample textbook solution
Students have asked these similar questions
2011 listing by carmax
of the ages and prices of various corollas in a ceratin region
س 11/ أ . اذا كانت 1 + x) = 2 x 3 + 2 x 2 + x) هي متعددة حدود محسوبة باستخدام طريقة
الفروقات المنتهية (finite differences) من جدول البيانات التالي للدالة (f(x . احسب قيمة . ( 2 درجة )
xi k=0 k=1 k=2 k=3
0
3
1
2
2
2
3
α
1. Differentiate between discrete and continuous random variables,
providing examples for each type.
2. Consider a discrete random variable representing the number of
patients visiting a clinic each day. The probabilities for the
number of visits are as follows:
0 visits: P(0) = 0.2
1 visit: P(1) = 0.3
2 visits: P(2) = 0.5
Using this information, calculate the expected value (mean) of
the number of patient visits per day. Show all your workings
clearly.
Rubric to follow
Definition of Random variables ( clearly and accurately differentiate between discrete and continuous random variables with appropriate examples for each)
Identification of discrete random variable (correctly identifies "number of patient visits" as a discrete random variable and explains reasoning clearly.)
Calculation of probabilities (uses the probabilities correctly in the calculation, showing all steps clearly and logically)
Expected value calculation (calculate the expected value (mean)…
Chapter 9 Solutions
ELEMENTARY SATISTICS IA
Ch. 9.1 - Verifying Requirements In the largest clinical...Ch. 9.1 - Verifying Requirements In the largest clinical...Ch. 9.1 - Hypotheses and Conclusions Refer to the hypothesis...Ch. 9.1 - Using Confidence Intervals a. Assume that we want...Ch. 9.1 - Interpreting Displays. In Exercises 5 and 6, use...Ch. 9.1 - Treating Carpal Tunnel Syndrome Carpal tunnel...Ch. 9.1 - Testing Claims About Proportions. In Exercises...Ch. 9.1 - Accuracy of Fast Food Drive-Through Orders In a...Ch. 9.1 - Testing Claims About Proportions. In Exercises...Ch. 9.1 - Testing Claims About Proportions. In Exercises...
Ch. 9.1 - Testing Claims About Proportions. In Exercises...Ch. 9.1 - Testing Claims About Proportions. In Exercises...Ch. 9.1 - Testing Claims About Proportions. In Exercises...Ch. 9.1 - Testing Claims About Proportions. In Exercises...Ch. 9.1 - Testing Claims About Proportions. In Exercises...Ch. 9.1 - Prob. 16BSCCh. 9.1 - Testing Claims About Proportions. In Exercises...Ch. 9.1 - Testing Claims About Proportions. In Exercises...Ch. 9.1 - Testing Claims About Proportions. In Exercises...Ch. 9.1 - Testing Claims About Proportions. In Exercises...Ch. 9.1 - Testing Claims About Proportions. In Exercises...Ch. 9.1 - Testing Claims About Proportions. In Exercises...Ch. 9.1 - Prob. 23BBCh. 9.1 - Yawning and Fishers Exact Test In one segment of...Ch. 9.1 - Overlap of Confidence Intervals In the article On...Ch. 9.1 - Equivalence of Hypothesis Test and Confidence...Ch. 9.2 - Independent and Dependent Samples Which of the...Ch. 9.2 - Confidence Interval for Hemoglobin Large samples...Ch. 9.2 - Hypothesis Tests and Confidence Intervals for...Ch. 9.2 - Degrees of Freedom For Example 1 on page 431, we...Ch. 9.2 - In Exercises 520, assume that the two samples are...Ch. 9.2 - In Exercises 520, assume that the two samples are...Ch. 9.2 - In Exercises 520, assume that the two samples are...Ch. 9.2 - In Exercises 520, assume that the two samples are...Ch. 9.2 - In Exercises 520, assume that the two samples are...Ch. 9.2 - In Exercises 520, assume that the two samples are...Ch. 9.2 - In Exercises 520, assume that the two samples are...Ch. 9.2 - In Exercises 520, assume that the two samples are...Ch. 9.2 - In Exercises 520, assume that the two samples are...Ch. 9.2 - In Exercises 520, assume that the two samples are...Ch. 9.2 - In Exercises 520, assume that the two samples are...Ch. 9.2 - In Exercises 520, assume that the two samples are...Ch. 9.2 - In Exercises 520, assume that the two samples are...Ch. 9.2 - In Exercises 520, assume that the two samples are...Ch. 9.2 - In Exercises 520, assume that the two samples are...Ch. 9.2 - In Exercises 520, assume that the two samples are...Ch. 9.2 - Larger Data Sets. In Exercises 2124, use the...Ch. 9.2 - Larger Data Sets. In Exercises 2124, use the...Ch. 9.2 - Larger Data Sets. In Exercises 2124, use the...Ch. 9.2 - Larger Data Sets. In Exercises 2124, use the...Ch. 9.2 - Pooling Repeat Exercise 12 IQ and Lead by assuming...Ch. 9.2 - Degrees of Freedom In Exercise 20 Blanking Out on...Ch. 9.2 - No Variation in a Sample An experiment was...Ch. 9.3 - True? For the methods of this section, which of...Ch. 9.3 - Notation Listed below are body temperatures from...Ch. 9.3 - Units of Measure If the values listed in Exercise...Ch. 9.3 - Degrees of Freedom If we use the sample data in...Ch. 9.3 - In Exercises 516, use the listed paired sample...Ch. 9.3 - In Exercises 516, use the listed paired sample...Ch. 9.3 - In Exercises 516, use the listed paired sample...Ch. 9.3 - In Exercises 516, use the listed paired sample...Ch. 9.3 - In Exercises 516, use the listed paired sample...Ch. 9.3 - In Exercises 516, use the listed paired sample...Ch. 9.3 - Prob. 11BSCCh. 9.3 - Prob. 12BSCCh. 9.3 - In Exercises 516, use the listed paired sample...Ch. 9.3 - In Exercises 516, use the listed paired sample...Ch. 9.3 - In Exercises 516, use the listed paired sample...Ch. 9.3 - In Exercises 516, use the listed paired sample...Ch. 9.3 - Prob. 17BSCCh. 9.3 - Larger Data Sets. In Exercises 1724, use the...Ch. 9.3 - Larger Data Sets. In Exercises 1724, use the...Ch. 9.3 - Larger Data Sets. In Exercises 1724, use the...Ch. 9.3 - Larger Data Sets. In Exercises 1724, use the...Ch. 9.3 - Larger Data Sets. In Exercises 1724, use the...Ch. 9.3 - Prob. 23BSCCh. 9.3 - Prob. 24BSCCh. 9.3 - Body Temperatures Refer to Data Set 3 Body...Ch. 9.4 - F Test Statistic a. If s12 represents the larger...Ch. 9.4 - F Test if using the sample data in Data Set 1 Body...Ch. 9.4 - Testing Normality For the hypothesis test...Ch. 9.4 - Prob. 4BSCCh. 9.4 - In Exercises 516, test the given claim. 5. Color...Ch. 9.4 - In Exercises 516, test the given claim. 6. Color...Ch. 9.4 - In Exercises 516, test the given claim. 7. Testing...Ch. 9.4 - In Exercises 516, test the given claim. 8....Ch. 9.4 - In Exercises 516, test the given claim. 9. Coke...Ch. 9.4 - In Exercises 516, test the given claim. 10. IQ and...Ch. 9.4 - Prob. 11BSCCh. 9.4 - Prob. 12BSCCh. 9.4 - Prob. 13BSCCh. 9.4 - Prob. 14BSCCh. 9.4 - In Exercises 516, test the given claim. 15. Old...Ch. 9.4 - In Exercises 516, test the given claim. 16....Ch. 9.4 - Prob. 17BBCh. 9.4 - Prob. 18BBCh. 9.4 - Finding Lower Critical F Values For hypothesis...Ch. 9 - In Exercises 15, use the following survey results:...Ch. 9 - In Exercises 1-5, use the following survey...Ch. 9 - In Exercises 1-5, use the following survey...Ch. 9 - In Exercises 1-5, use the following survey...Ch. 9 - In Exercises 7-5, use the following survey...Ch. 9 - True? Determine whether the following statement is...Ch. 9 - True? When we collect random samples to test the...Ch. 9 - Dependent or Independent? Listed below are...Ch. 9 - Hypotheses Identify the null and alternative...Ch. 9 - Test Statistics Identify the test statistic that...Ch. 9 - Denomination Effect In the article The...Ch. 9 - Denomination Effect Construct the confidence...Ch. 9 - Heights Listed below are heights (cm) randomly...Ch. 9 - Heights Use a 0.01 significance level with the...Ch. 9 - Before /After Treatment Results Captopril is a...Ch. 9 - Eyewitness Accuracy of Police Does stress affect...Ch. 9 - Are Flights Cheaper When Scheduled Earlier? Listed...Ch. 9 - Variation of Heights Use the sample data given in...Ch. 9 - Family Heights. In Exercises 15, use the following...Ch. 9 - Scatterplot Construct a scatterplot of the...Ch. 9 - Family Heights. In Exercises 1-5, use the...Ch. 9 - Family Heights. In Exercises 1-5, use the...Ch. 9 - Assessing Normality Interpret the normal quantile...Ch. 9 - Braking Reaction Times: Histogram Listed below are...Ch. 9 - Braking Reaction Times: Normal? The accompanying...Ch. 9 - Braking Reaction Times: Boxplots Use the same data...Ch. 9 - In Exercises 5-20, assume that the two samples are...Ch. 9 - Braking Reaction Times: Confidence Intervals a....Ch. 9 - FROM DATA TO DECISION Critical Thinking: Did the...Ch. 9 - Critical Thinking: Did the NFL Rule Change Have...Ch. 9 - Critical Thinking: Did the NFL Rule Change Have...
Knowledge Booster


Learn more about
Need a deep-dive on the concept behind this application? Look no further. Learn more about this topic, statistics and related others by exploring similar questions and additional content below.Similar questions
- if the b coloumn of a z table disappeared what would be used to determine b column probabilitiesarrow_forwardConstruct a model of population flow between metropolitan and nonmetropolitan areas of a given country, given that their respective populations in 2015 were 263 million and 45 million. The probabilities are given by the following matrix. (from) (to) metro nonmetro 0.99 0.02 metro 0.01 0.98 nonmetro Predict the population distributions of metropolitan and nonmetropolitan areas for the years 2016 through 2020 (in millions, to four decimal places). (Let x, through x5 represent the years 2016 through 2020, respectively.) x₁ = x2 X3 261.27 46.73 11 259.59 48.41 11 257.96 50.04 11 256.39 51.61 11 tarrow_forwardIf the average price of a new one family home is $246,300 with a standard deviation of $15,000 find the minimum and maximum prices of the houses that a contractor will build to satisfy 88% of the market valuearrow_forward
- 21. ANALYSIS OF LAST DIGITS Heights of statistics students were obtained by the author as part of an experiment conducted for class. The last digits of those heights are listed below. Construct a frequency distribution with 10 classes. Based on the distribution, do the heights appear to be reported or actually measured? Does there appear to be a gap in the frequencies and, if so, how might that gap be explained? What do you know about the accuracy of the results? 3 4 555 0 0 0 0 0 0 0 0 0 1 1 23 3 5 5 5 5 5 5 5 5 5 5 5 5 6 6 8 8 8 9arrow_forwardA side view of a recycling bin lid is diagramed below where two panels come together at a right angle. 45 in 24 in Width? — Given this information, how wide is the recycling bin in inches?arrow_forward1 No. 2 3 4 Binomial Prob. X n P Answer 5 6 4 7 8 9 10 12345678 8 3 4 2 2552 10 0.7 0.233 0.3 0.132 7 0.6 0.290 20 0.02 0.053 150 1000 0.15 0.035 8 7 10 0.7 0.383 11 9 3 5 0.3 0.132 12 10 4 7 0.6 0.290 13 Poisson Probability 14 X lambda Answer 18 4 19 20 21 22 23 9 15 16 17 3 1234567829 3 2 0.180 2 1.5 0.251 12 10 0.095 5 3 0.101 7 4 0.060 3 2 0.180 2 1.5 0.251 24 10 12 10 0.095arrow_forward
- step by step on Microssoft on how to put this in excel and the answers please Find binomial probability if: x = 8, n = 10, p = 0.7 x= 3, n=5, p = 0.3 x = 4, n=7, p = 0.6 Quality Control: A factory produces light bulbs with a 2% defect rate. If a random sample of 20 bulbs is tested, what is the probability that exactly 2 bulbs are defective? (hint: p=2% or 0.02; x =2, n=20; use the same logic for the following problems) Marketing Campaign: A marketing company sends out 1,000 promotional emails. The probability of any email being opened is 0.15. What is the probability that exactly 150 emails will be opened? (hint: total emails or n=1000, x =150) Customer Satisfaction: A survey shows that 70% of customers are satisfied with a new product. Out of 10 randomly selected customers, what is the probability that at least 8 are satisfied? (hint: One of the keyword in this question is “at least 8”, it is not “exactly 8”, the correct formula for this should be = 1- (binom.dist(7, 10, 0.7,…arrow_forwardKate, Luke, Mary and Nancy are sharing a cake. The cake had previously been divided into four slices (s1, s2, s3 and s4). What is an example of fair division of the cake S1 S2 S3 S4 Kate $4.00 $6.00 $6.00 $4.00 Luke $5.30 $5.00 $5.25 $5.45 Mary $4.25 $4.50 $3.50 $3.75 Nancy $6.00 $4.00 $4.00 $6.00arrow_forwardFaye cuts the sandwich in two fair shares to her. What is the first half s1arrow_forward
- Question 2. An American option on a stock has payoff given by F = f(St) when it is exercised at time t. We know that the function f is convex. A person claims that because of convexity, it is optimal to exercise at expiration T. Do you agree with them?arrow_forwardQuestion 4. We consider a CRR model with So == 5 and up and down factors u = 1.03 and d = 0.96. We consider the interest rate r = 4% (over one period). Is this a suitable CRR model? (Explain your answer.)arrow_forwardQuestion 3. We want to price a put option with strike price K and expiration T. Two financial advisors estimate the parameters with two different statistical methods: they obtain the same return rate μ, the same volatility σ, but the first advisor has interest r₁ and the second advisor has interest rate r2 (r1>r2). They both use a CRR model with the same number of periods to price the option. Which advisor will get the larger price? (Explain your answer.)arrow_forward
arrow_back_ios
SEE MORE QUESTIONS
arrow_forward_ios
Recommended textbooks for you
 Big Ideas Math A Bridge To Success Algebra 1: Stu...AlgebraISBN:9781680331141Author:HOUGHTON MIFFLIN HARCOURTPublisher:Houghton Mifflin Harcourt
 Glencoe Algebra 1, Student Edition, 9780079039897...AlgebraISBN:9780079039897Author:CarterPublisher:McGraw Hill
 Trigonometry (MindTap Course List)TrigonometryISBN:9781337278461Author:Ron LarsonPublisher:Cengage Learning
 Trigonometry (MindTap Course List)TrigonometryISBN:9781305652224Author:Charles P. McKeague, Mark D. TurnerPublisher:Cengage Learning
 Functions and Change: A Modeling Approach to Coll...AlgebraISBN:9781337111348Author:Bruce Crauder, Benny Evans, Alan NoellPublisher:Cengage Learning
Big Ideas Math A Bridge To Success Algebra 1: Stu...
Algebra
ISBN:9781680331141
Author:HOUGHTON MIFFLIN HARCOURT
Publisher:Houghton Mifflin Harcourt
Glencoe Algebra 1, Student Edition, 9780079039897...
Algebra
ISBN:9780079039897
Author:Carter
Publisher:McGraw Hill
Trigonometry (MindTap Course List)
Trigonometry
ISBN:9781337278461
Author:Ron Larson
Publisher:Cengage Learning
Trigonometry (MindTap Course List)
Trigonometry
ISBN:9781305652224
Author:Charles P. McKeague, Mark D. Turner
Publisher:Cengage Learning
Functions and Change: A Modeling Approach to Coll...
Algebra
ISBN:9781337111348
Author:Bruce Crauder, Benny Evans, Alan Noell
Publisher:Cengage Learning
Continuous Probability Distributions - Basic Introduction; Author: The Organic Chemistry Tutor;https://www.youtube.com/watch?v=QxqxdQ_g2uw;License: Standard YouTube License, CC-BY
Probability Density Function (p.d.f.) Finding k (Part 1) | ExamSolutions; Author: ExamSolutions;https://www.youtube.com/watch?v=RsuS2ehsTDM;License: Standard YouTube License, CC-BY
Find the value of k so that the Function is a Probability Density Function; Author: The Math Sorcerer;https://www.youtube.com/watch?v=QqoCZWrVnbA;License: Standard Youtube License