
Videos
The following summary data on bending strength (lb-in/in) of joints is taken from the article “Bending Strength of Corner Joints Constructed with Injection Molded Splines” (Forest Products J., April, 1997: 89–92).
| Sample | Sample | Sample | |
| Type | Size | SD | |
| Without side coating | 10 | 80.95 | 9.59 |
| With side coating | 10 | 63.23 | 5.96 |
a. Calculate a 95% lower confidence bound for true average strength of joints with a side coating.
b. Calculate a 95% lower prediction bound for the strength of a single joint with a side coating. c. Calculate an interval that, with 95% confidence, includes the strength values for at least 95% of the population of all joints with side coatings.
d. Calculate a 95% confidence interval for the difference between true average strengths for the two types of joints.
a.
Calculate the 95% lower confidence bound for the true average strength of the joints with a side coating.
Answer to Problem 72SE
The 95% lower confidence bound for the true average bending strength of the joints with a side coatingis at least59.78(lb-in/in).
Explanation of Solution
Given info:
The information is based on the bending strength (lb-in/in) of the joints:
Let
Calculation:
Lower Confidence interval:
The Lower Confidence level can be defined is,
Where
Lower Confidence interval:
Step-by-step procedure to obtain the confidence interval using the MINITAB software:
- Choose Stat > Basic Statistics > One sample t.
- Choose Summarized columns. Enter the sample mean as 63.23 and standard deviation as 5.96.
- Choose Options.
- In Confidence level, enter 95.
- In Alternative, select Greater than.
- Click OK in all the dialog boxes.
Output using the MINITAB software is given below:
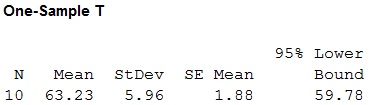
From the MINITAB output, the lower confidence bound is 59.78.
Interpretation:
Thus, The 95% lower confidence bound for the true average bending strength of the joints with a side coating is at least 59.78(lb-in/in).
b.
Calculate the 95% lower prediction bound for the true average strength of the single joint with a side coating.
Answer to Problem 72SE
The 95% lower prediction bound for the true average bending strength of the single joint with a side coating will be at least 51.77(lb-in/in).
Explanation of Solution
Given info:
Let
Calculation:
Lower Prediction interval:
Where
Degrees of freedom:
The degrees of freedom is
Thus, for sample of size 10,
Hence, the degrees of freedom are 9.
Level of significance:
It is given that the level of significance is 0.05.
The lower prediction bound for the true average bending strength of the single joint with a side coating is obtained as given below:
From Appendix Tables, “Table A.5 Critical Values for t Distribution”, the critical value for the 9df with level of significance 0.025 is
The lower prediction bound is given by;
Thus, the 95% lower prediction bound is 51.77.
Thus, the 95% lower prediction bound for the true average bending strength of the single joint with a side coating will be at least 51.77(lb-in/in).
c.
Calculate the 95% confidence interval that includes the strength values for at least 95% of the population of all joints with side coatings.
Answer to Problem 72SE
The 95% confidence interval that includes the strength values for at least 95% of the population of all joints with side coatings lies between 43.09(lb-in/in) and 83.37(lb-in/in).
Explanation of Solution
Given info:
Let
Calculation:
To find thestrength values for at least 95%, use the method of tolerance interval.
Tolerance interval:
Where
Degrees of freedom:
The degrees of freedom is
Thus, for sample of size 10,
Hence, the degrees of freedom are 9.
Level of significance:
It is given that the level of significance is 0.05.
The tolerance intervalthat includes the strength values for at least 95% of the population of all joints with side coatings is obtained as given below:
From Appendix Tables, “Table A.6 Tolerance Critical Values for Normal population Distribution”, the tolerance critical value for the n = 10 with confidence level 95% for 95% population is
The interval is given by;
Thus, the 95% tolerance interval is (43.09, 83.37).
Thus, the 95% tolerance interval that includes the strength values for at least 95% of the population of all joints with side coatings lies between 43.09(lb-in/in) and 83.37(lb-in/in).
Interpretation:
Hence it is highly confident that at least 95% of the population of all joints with side coatings have the bend strength between 43.09(lb-in/in) and 83.37(lb-in/in).
d.
Find the 95% confidence interval for the difference between two average strengths for the two types of joints.
Answer to Problem 72SE
The interpretation is, there is 95% confidence that the average strength for the joints without side coating is greater than that of strength for the joints with side coating by between10.11(lb-in/in) and 25.33(lb-in/in).
Explanation of Solution
Given info:
Let
Calculation:
Let
Requirements for a two sample t-test:
- The sample X and Y taken from the population is selected at random.
- The samples X and Y are dependent of each other.
- Samples must be distributed to normal.
Here, the samples selected from the strength without coating and with coating were selected at random and dependent. Moreover, the sample size is assumed to be normally distributed. Hence, the assumptions are satisfied.
Thus, the condition is satisfied.
Confidence interval:
The confidence interval is given as,
Where
Confidence interval:
Step-by-step procedure to obtain the confidence interval using the MINITAB software:
- Choose Stat > Basic Statistics > 2-sample t test.
- Choose Summarized data.
- In first, enter Sample size as 10, Mean as 80.95, Standard deviation as 9.59.
- In second, enter Sample size as 10, Mean as 63.23, Standard deviation as 5.96.
- Choose Options.
- In Confidence level, enter 95.
- In Alternative, select Not equal.
- Click OK in all the dialog boxes.
Output using the MINITAB software is given below:
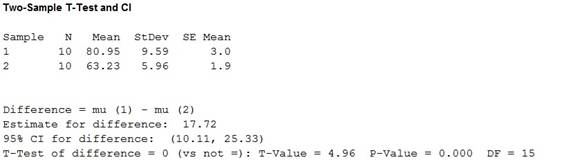
From the MINITAB output, the confidence interval is (10.11, 25.33).
Thus, there is 95% confidence that the average strength for the joints without side coating is greater than that of strength for the joints with side coating by between 10.11(lb-in/in).and 25.33(lb-in/in).
Want to see more full solutions like this?
Chapter 9 Solutions
Bundle: Probability and Statistics for Engineering and the Sciences, Loose-leaf Version, 9th + WebAssign Printed Access Card, Multi-Term Courses


- Do bonds reduce the overall risk of an investment portfolio? Let x be a random variable representing annual percent return for the Vanguard Total Stock Index (all Stocks). Let y be a random variable representing annual return for the Vanguard Balanced Index (60% stock and 40% bond). For the past several years, assume the following data. Compute the coefficient of variation for each fund. Round your answers to the nearest tenth. x: 14 0 37 21 35 23 24 -14 -14 -17 y: 8 -2 29 17 22 17 17 -2 -3 -8arrow_forwardWhat percentage of the general U.S. population have bachelor's degrees? Suppose that the Statistical Abstract of the United States, 120th Edition, gives the following percentage of bachelor’s degrees by state. For convenience, the data are sorted in increasing order. 17 18 18 18 19 20 20 20 21 21 21 21 21 22 22 22 22 22 23 23 24 24 24 24 24 25 25 25 25 26 26 26 26 26 26 27 27 27 28 28 28 29 29 31 31 32 32 34 35 38 Illinois has a bachelor's degree percentage rate of about 18%. Into what quartile does this rate fall?arrow_forwardWhat percentage of the general U.S. population have bachelor's degrees? Suppose that the Statistical Abstract of the United States, 120th Edition, gives the following percentage of bachelor’s degrees by state. For convenience, the data are sorted in increasing order. 17 18 18 18 19 20 20 20 21 21 21 21 21 22 22 22 22 22 23 23 24 24 24 24 24 25 25 25 25 26 26 26 26 26 26 27 27 27 28 28 28 29 29 31 31 32 32 34 35 38 Illinois has a bachelor's degree percentage rate of about 18%. Into what quartile does this rate fall?arrow_forward
- Find the range for the following sample data. x 23 17 11 30 27arrow_forwardDo bonds reduce the overall risk of an investment portfolio? Let x be a random variable representing annual percent return for the Vanguard Total Stock Index (all Stocks). Let y be a random variable representing annual return for the Vanguard Balanced Index (60% stock and 40% bond). For the past several years, assume the following data. Compute the sample mean for x and for y. Round your answer to the nearest tenth. x: 11 0 36 22 34 24 25 -11 -11 -22 y: 9 -3 28 14 23 16 14 -3 -4 -9arrow_forwardDo bonds reduce the overall risk of an investment portfolio? Let x be a random variable representing annual percent return for the Vanguard Total Stock Index (all Stocks). Let y be a random variable representing annual return for the Vanguard Balanced Index (60% stock and 40% bond). For the past several years, assume the following data. Compute the range for variable y. X 12 0 36 21 35 23 24 -12 -12 -21 Y 10 -2 26 15 22 18 15 -2 -3 -10arrow_forward
- Do bonds reduce the overall risk of an investment portfolio? Let x be a random variable representing annual percent return for the Vanguard Total Stock Index (all Stocks). Let y be a random variable representing annual return for the Vanguard Balanced Index (60% stock and 40% bond). For the past several years, assume the following data. Compute the range for variable y. X 12 0 36 21 35 23 24 -12 -12 -21 Y 10 -2 26 15 22 18 15 -2 -3 -10arrow_forwardDo bonds reduce the overall risk of an investment portfolio? Let x be a random variable representing annual percent return for the Vanguard Total Stock Index (all Stocks). Let y be a random variable representing annual return for the Vanguard Balanced Index (60% stock and 40% bond). For the past several years, assume the following data. Compute the range for variable x. X 15 0 37 23 33 25 26 -15 -15 -23 Y 6 -1 28 18 24 17 18 -1 -2 -6arrow_forward7.16. If the probability density of X is given by g kx³ for x>0 f(x) = (1+2x)6 0 10-01, elsewhere trolls inf ( 2X density of the random variable Y = where k is an appropriate constant, find the probability 1+2X distribution of Y, and thus determine the value of k. 7 Identify thearrow_forward
- 7.1. If X has an exponential distribution with the parameter 0, use the distribution function technique to find the probability density of the random variable Y = ln X. bilaga in dwreatarrow_forward3. Pleasearrow_forwardWhat does the margin of error include? When a margin of error is reported for a survey, it includes a. random sampling error and other practical difficulties like undercoverage and non-response b. random sampling error, but not other practical difficulties like undercoverage and nonresponse c. practical difficulties like undercoverage and nonresponse, but not random smapling error d. none of the above is corretarrow_forward
 Glencoe Algebra 1, Student Edition, 9780079039897...AlgebraISBN:9780079039897Author:CarterPublisher:McGraw Hill