
Videos
The accompanying summary data on compression strength (lb) for 12 × 10 × 8 in. boxes appeared in the article “Compression of Single-Wall Corrugated Shipping Containers Using Fixed and Floating Test Platens” (J. Testing and Evaluation, 1992: 318–320). The authors stated that “the difference between the compression strength using fixed and floating platen method was found to be small compared to normal variation in compression strength between identical boxes.” Do you agree? Is your analysis predicated on any assumptions?
| Sample | Sample | Sample | |
| Method | Size | SD | |
| Fixed | 10 | 807 | 27 |
| Floating | 10 | 757 | 41 |
Check whether the claim that the “difference between compression strength using fixed method and floating platen is smaller than the normal variation in compression strength between identical boxes” is appropriate.
Check whether the analysis is based on any assumptions.
Answer to Problem 67SE
The authors claim that “difference between compression strength using fixed method and floating platen is smaller than the normal variation in compression strength between identical boxes” is not agreed.
Yes, the analysis is based on certain assumptions.
Explanation of Solution
Given info:
Let
Calculation:
Here,
The test hypotheses are,
Null hypothesis:
That is, the mean compression strength fixed method is different from the floating platen method.
Alternative hypothesis:
That is, there is evidence that the mean compression strength fixed method is different from the floating platen method.
Assumption for the two sample t-test:
- The samples X and Y are selected from the population at random.
- The samples X and Y are independent of each other.
- Samples must be distributed normally.
Here, the samples selected from the fixed method and floating method were selected at random and independently. Moreover, the sample size is large and distributed normally. Hence, the assumptions are satisfied.
Conduct the two-sample t-test to test the hypotheses.
Test statistic:
Step-by-step procedure to obtain the test statistic using the MINITAB software:
- Choose Stat > Basic Statistics > 2-Sample t.
- Choose Sample from the columns.
- In first, enter Sample size as 10, Mean as 807, Standard deviation as 27.
- In second, enter Sample size as 10, Mean as 757, Standard deviation as 41.
- Choose Options.
- In Confidence level, enter 95.
- In Alternative, select Not equal.
- Click OK in all the dialog boxes.
Output using the MINITAB software is given below:
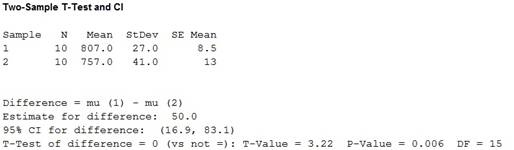
From the output, the test statistic is 3.22 and the P- value is 0.006.
Rejection rule:
If
Conclusion:
Here, the P-value is less than the level of significance.
That is,
Therefore, the decision is “reject the null hypothesis”.
Thus, it can be concluded that there is evidence that the mean compression strength fixed method is different from the floating platen method.
The authors claim that “difference between compression strength using fixed method and floating platen is smaller than the normal variation in compression strength between identical boxes” is not agreed.
Here, the sample size of the compression strength data is small and it is assumed to be distributed to normal. Also, it is assumed that the data were selected at random and independent.
Want to see more full solutions like this?
Chapter 9 Solutions
EBK PROBABILITY AND STATISTICS FOR ENGI


- A well-known company predominantly makes flat pack furniture for students. Variability with the automated machinery means the wood components are cut with a standard deviation in length of 0.45 mm. After they are cut the components are measured. If their length is more than 1.2 mm from the required length, the components are rejected. a) Calculate the percentage of components that get rejected. b) In a manufacturing run of 1000 units, how many are expected to be rejected? c) The company wishes to install more accurate equipment in order to reduce the rejection rate by one-half, using the same ±1.2mm rejection criterion. Calculate the maximum acceptable standard deviation of the new process.arrow_forward5. Let X and Y be independent random variables and let the superscripts denote symmetrization (recall Sect. 3.6). Show that (X + Y) X+ys.arrow_forward8. Suppose that the moments of the random variable X are constant, that is, suppose that EX" =c for all n ≥ 1, for some constant c. Find the distribution of X.arrow_forward
- 9. The concentration function of a random variable X is defined as Qx(h) = sup P(x ≤ X ≤x+h), h>0. Show that, if X and Y are independent random variables, then Qx+y (h) min{Qx(h). Qr (h)).arrow_forward10. Prove that, if (t)=1+0(12) as asf->> O is a characteristic function, then p = 1.arrow_forward9. The concentration function of a random variable X is defined as Qx(h) sup P(x ≤x≤x+h), h>0. (b) Is it true that Qx(ah) =aQx (h)?arrow_forward
- 3. Let X1, X2,..., X, be independent, Exp(1)-distributed random variables, and set V₁₁ = max Xk and W₁ = X₁+x+x+ Isk≤narrow_forward7. Consider the function (t)=(1+|t|)e, ER. (a) Prove that is a characteristic function. (b) Prove that the corresponding distribution is absolutely continuous. (c) Prove, departing from itself, that the distribution has finite mean and variance. (d) Prove, without computation, that the mean equals 0. (e) Compute the density.arrow_forward1. Show, by using characteristic, or moment generating functions, that if fx(x) = ½ex, -∞0 < x < ∞, then XY₁ - Y2, where Y₁ and Y2 are independent, exponentially distributed random variables.arrow_forward
- 1. Show, by using characteristic, or moment generating functions, that if 1 fx(x): x) = ½exarrow_forward1990) 02-02 50% mesob berceus +7 What's the probability of getting more than 1 head on 10 flips of a fair coin?arrow_forward9. The concentration function of a random variable X is defined as Qx(h) sup P(x≤x≤x+h), h>0. = x (a) Show that Qx+b(h) = Qx(h).arrow_forward
 MATLAB: An Introduction with ApplicationsStatisticsISBN:9781119256830Author:Amos GilatPublisher:John Wiley & Sons Inc
 Probability and Statistics for Engineering and th...StatisticsISBN:9781305251809Author:Jay L. DevorePublisher:Cengage Learning
 Statistics for The Behavioral Sciences (MindTap C...StatisticsISBN:9781305504912Author:Frederick J Gravetter, Larry B. WallnauPublisher:Cengage Learning
 Elementary Statistics: Picturing the World (7th E...StatisticsISBN:9780134683416Author:Ron Larson, Betsy FarberPublisher:PEARSON
 The Basic Practice of StatisticsStatisticsISBN:9781319042578Author:David S. Moore, William I. Notz, Michael A. FlignerPublisher:W. H. Freeman
 Introduction to the Practice of StatisticsStatisticsISBN:9781319013387Author:David S. Moore, George P. McCabe, Bruce A. CraigPublisher:W. H. Freeman