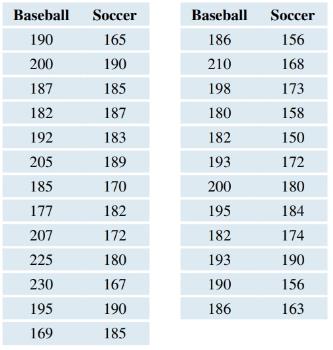
College Athletes’ Weights A random sample of male college baseball players and a random sample of male college soccer players were obtained independently and weighed. The following table shows the unstacked weights (in pounds). The distributions of both data sets suggest that the population distributions are roughly Normal. Determine whether the difference in means is significant, using a significance level of 0.05 .
College Athletes’ Weights A random sample of male college baseball players and a random sample of male college soccer players were obtained independently and weighed. The following table shows the unstacked weights (in pounds). The distributions of both data sets suggest that the population distributions are roughly Normal. Determine whether the difference in means is significant, using a significance level of 0.05 .
Solution Summary: The author explains that there is enough evidence to conclude that the difference in mean weights of baseball and soccer players is significant.
College Athletes’ Weights A random sample of male college baseball players and a random sample of male college soccer players were obtained independently and weighed. The following table shows the unstacked weights (in pounds). The distributions of both data sets suggest that the population distributions are roughly Normal. Determine whether the difference in means is significant, using a significance level of
0.05
.
Definition Definition Number of subjects or observations included in a study. A large sample size typically provides more reliable results and better representation of the population. As sample size and width of confidence interval are inversely related, if the sample size is increased, the width of the confidence interval decreases.
08:34
◄ Classroom
07:59
Probs. 5-32/33
D
ا.
89
5-34. Determine the horizontal and vertical components
of reaction at the pin A and the normal force at the smooth
peg B on the member.
A
0,4 m
0.4 m
Prob. 5-34
F=600 N
fr
th
ar
0.
163586
5-37. The wooden plank resting between the buildings
deflects slightly when it supports the 50-kg boy. This
deflection causes a triangular distribution of load at its ends.
having maximum intensities of w, and wg. Determine w
and wg. each measured in N/m. when the boy is standing
3 m from one end as shown. Neglect the mass of the plank.
0.45 m
3 m
Examine the Variables: Carefully review and note the names of all variables in the dataset. Examples of these variables include:
Mileage (mpg)
Number of Cylinders (cyl)
Displacement (disp)
Horsepower (hp)
Research: Google to understand these variables.
Statistical Analysis: Select mpg variable, and perform the following statistical tests. Once you are done with these tests using mpg variable, repeat the same with hp
Mean
Median
First Quartile (Q1)
Second Quartile (Q2)
Third Quartile (Q3)
Fourth Quartile (Q4)
10th Percentile
70th Percentile
Skewness
Kurtosis
Document Your Results:
In RStudio: Before running each statistical test, provide a heading in the format shown at the bottom. “# Mean of mileage – Your name’s command”
In Microsoft Word: Once you've completed all tests, take a screenshot of your results in RStudio and paste it into a Microsoft Word document. Make sure that snapshots are very clear. You will need multiple snapshots. Also transfer these results to the…
Chapter 9 Solutions
The King's minion: Richelieu, Louis XIII, and the affair of Cinq-Mars
Need a deep-dive on the concept behind this application? Look no further. Learn more about this topic, statistics and related others by exploring similar questions and additional content below.
Hypothesis Testing and Confidence Intervals (FRM Part 1 – Book 2 – Chapter 5); Author: Analystprep;https://www.youtube.com/watch?v=vth3yZIUlGQ;License: Standard YouTube License, CC-BY


 Glencoe Algebra 1, Student Edition, 9780079039897...AlgebraISBN:9780079039897Author:CarterPublisher:McGraw Hill
 Big Ideas Math A Bridge To Success Algebra 1: Stu...AlgebraISBN:9781680331141Author:HOUGHTON MIFFLIN HARCOURTPublisher:Houghton Mifflin Harcourt