
Ten Lessons in Introductory Sociology
2nd Edition
ISBN: 9780190663872
Author: Kenneth A. Gould; Tammy L. Lewis
Publisher: Oxford University Press Academic US
expand_more
expand_more
format_list_bulleted
Videos
Textbook Question
Chapter 9, Problem 63SE
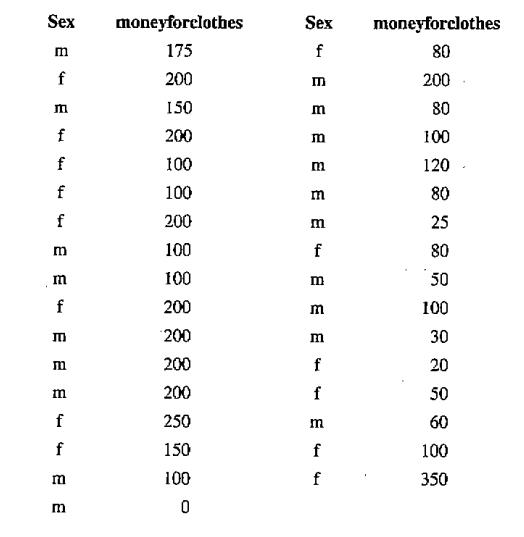
Clothes Spending A random sample of 14 college women and a random sample of 19 college-men were separately asked to estimate how much they spent on clothing in the last month. The table shows the data.
Test the hypothesis that the population
Expert Solution & Answer
Want to see the full answer?
Check out a sample textbook solution
Students have asked these similar questions
Sand and clay studies were conducted at a site in California. Twelve consecutive depths, each about 15 cm deep, were studied and the following percentages of sand in the soil were recorded.
34.4
27.1
30.8
28.0
32.2
27.6
32.8
25.2
31.4
33.5
24.7
28.4
Converting this sequence of numbers to a sequence of symbols A and B, where A indicates a value above the median and B denotes a value below the median gives ABABABABAABB. Test the sequence for randomness about the median with a 5% level of significance. Verify that the number of runs is 10. What is the upper critical value c2?
29% of all college students major in STEM (Science, Technology, Engineering, and Math). If 46 college students are randomly selected, find the probability thata. Exactly 11 of them major in STEM. b. At most 12 of them major in STEM. c. At least 11 of them major in STEM. d. Between 11 and 15 (including 11 and 15) of them major in STEM.
Sand and clay studies were conducted at a site in California. Twelve consecutive depths, each about 15 cm deep, were studied and the following percentages of sand in the soil were recorded.
27.3
34.6
30.6
27.8
33.4
31.5
27.3
31.2
32.0
24.7
24.4
28.2
Test this sequence for randomness about the median. Converting this sequence of numbers to a sequence of symbols A and B, where A indicates a value above the median and B denotes a value below the median gives BAABAABAABBB. Verify that the number of runs is 7, the lower critical number is 3, and the upper critical number is 11. Use a 5% level of significance. State the conclusion of the test and interpret your results.
Chapter 9 Solutions
Ten Lessons in Introductory Sociology
Ch. 9 - Ages A study of all the students at a small...Ch. 9 - Units A survey of 100 random full-time students at...Ch. 9 - Exam Scores The distribution of the scores on a...Ch. 9 - Exam Scores The distribution of the scores on a...Ch. 9 - Prob. 5SECh. 9 - Cellphone Calls Answers.com claims that the mean...Ch. 9 - Retirement Income Several times during the year,...Ch. 9 - Time Employed A human resources manager for a...Ch. 9 - Prob. 9SECh. 9 - Prob. 10SE
Ch. 9 - Babies Weights (Example 2) Some sources report...Ch. 9 - Babies’ Weights, Again Some sources report that...Ch. 9 - Prob. 13SECh. 9 - Prob. 14SECh. 9 - CLT Shapes (Example 4) One of the histograms is a...Ch. 9 - Prob. 16SECh. 9 - Prob. 17SECh. 9 - Student Ages The mean age of all 2550 students at...Ch. 9 - Prob. 19SECh. 9 - Prob. 20SECh. 9 - Prob. 21SECh. 9 - Prob. 22SECh. 9 - Prob. 23SECh. 9 - Random Numbers If you take samples of 40 lines...Ch. 9 - t* (Example 8) A researcher collects one sample of...Ch. 9 - t* A researcher collects a sample of 25...Ch. 9 - Hamburgers (Example 9) A hamburger chain sells...Ch. 9 - Drinks A fast-food chain sells drinks that it...Ch. 9 - Men’s Pulse Rates (Example 10) A random sample of...Ch. 9 - Prob. 30SECh. 9 - Prob. 31SECh. 9 - Prob. 32SECh. 9 - Confidence Interval Changes State whether each of...Ch. 9 - Confidence Interval Changes State whether each of...Ch. 9 - Potatoes The weights of four randomly and...Ch. 9 - Tomatoes The weights of four randomly and...Ch. 9 - Human Body Temperatures (Example 12) A random...Ch. 9 - Reaction Distance Data on the disk and website...Ch. 9 - Potatoes Use the data from exercise 9.35. a. If...Ch. 9 - Tomatoes Use the data from exercise 9.36. a. Using...Ch. 9 - Cholesterol In the U.S. Department of Health has...Ch. 9 - BMI A body mass index (BMI) of more than 25 is...Ch. 9 - Male Height In the United States, the population...Ch. 9 - Vegetarians' Weights The mean weight of all...Ch. 9 - GPAs Thirty GPAs from a randomly selected sample...Ch. 9 - Prob. 46SECh. 9 - GPAs Using the data from Exercise 9.45 on GPAs,...Ch. 9 - Prob. 48SECh. 9 - Atkins Diet Difference Ten people went on an...Ch. 9 - Pulse Difference The following numbers are the...Ch. 9 - Student Ages Suppose that 200 statistics students...Ch. 9 - Presidents’ Ages at Inauguration A 95 confidence...Ch. 9 - Prob. 53SECh. 9 - Prob. 54SECh. 9 - Televisions: CI (Example 14) Minitab output is...Ch. 9 - Pulse and Gender: CI Using data from NHANES, we...Ch. 9 - Televisions (Example 15) The table shows the...Ch. 9 - Pulse Rates Using data from NHANES, we looked at...Ch. 9 - Triglycerides Triglycerides are a form of fat...Ch. 9 - Systolic Blood Pressures When you have your blood...Ch. 9 - Triglycerides, Again Report and interpret the 95...Ch. 9 - Blood Pressures, Again Report and interpret the 95...Ch. 9 - Clothes Spending A random sample of 14 college...Ch. 9 - College Athletes’ Weights A random sample of male...Ch. 9 - Prob. 65SECh. 9 - College Athletes’ Weights In exercise 9.64, you...Ch. 9 - Textbook Prices, UCSB vs. CSUN (Example 16) The...Ch. 9 - Textbook Prices. OC vs. CSUN The prices of a...Ch. 9 - Females’ Pulse Rates before and after a Fright...Ch. 9 - Males’ Pulse Rates before and after a Fright...Ch. 9 - Organic Food A student compared organic food...Ch. 9 - Smoking Mothers The birth weights of 35 babies...Ch. 9 - Ages of Brides and Grooms Data for the ages of...Ch. 9 - Surfers Surfers and statistics students Rex...Ch. 9 - Self-Reported Heights of Men (Example 18) A random...Ch. 9 - Eating Out Jacqueline Loya, a statistics student,...Ch. 9 - 9.77, 9.79, and 9.80 For these questions, the data...Ch. 9 - Prob. 78SECh. 9 - 9.77, 9.79, and 9.80 For these questions, the data...Ch. 9 - 9.77, 9.79, and 9.80 For these questions, the data...Ch. 9 - Choose a test for each situation: one-sample...Ch. 9 - Choose a t-test for each situation: one-sample...Ch. 9 - Cones: 3 Tests A McDonald’s fact sheet says its...Ch. 9 - Prob. 84CRECh. 9 - Brain Size Brain size for 20 random women and 20...Ch. 9 - Prob. 86CRECh. 9 - Heart Rate before and after Coffee Elena Lucin, a...Ch. 9 - Exam Grades The final exam grades for a sample of...Ch. 9 - Hours of Television Viewing The number of hours...Ch. 9 - Reaction Distances Reaction distances in...Ch. 9 - Shift Sleep Hours A survey was done comparing the...Ch. 9 - Prob. 92CRECh. 9 - Maximum Tax Rate A random sample of 10 Democrats...Ch. 9 - Prob. 94CRECh. 9 - Groceries The table shows the prices of identical...Ch. 9 - Parents The following table shows the heights (in...Ch. 9 - Why Is n1 in the Sample Standard Deviation? Why do...Ch. 9 - Prob. 98CRECh. 9 - Construct two sets of body temperatures (in...Ch. 9 - Construct heights for 3 or more sets of twins (6...
Additional Math Textbook Solutions
Find more solutions based on key concepts
1. How much money is Joe earning when he’s 30?
Pathways To Math Literacy (looseleaf)
1. How is a sample related to a population?
Elementary Statistics: Picturing the World (7th Edition)
First Derivative Test a. Locale the critical points of f. b. Use the First Derivative Test to locale the local ...
Calculus: Early Transcendentals (2nd Edition)
The first derivative of function y=25x4.
Calculus for Business, Economics, Life Sciences, and Social Sciences (14th Edition)
(a) Make a stem-and-leaf plot for these 24 observations on the number of customers who used a down-town CitiBan...
APPLIED STAT.IN BUS.+ECONOMICS
The largest polynomial that divides evenly into a list of polynomials is called the _______.
Elementary & Intermediate Algebra
Knowledge Booster


Learn more about
Need a deep-dive on the concept behind this application? Look no further. Learn more about this topic, statistics and related others by exploring similar questions and additional content below.Similar questions
- 29% of all college students major in STEM (Science, Technology, Engineering, and Math). If 46 college students are randomly selected, find the probability thata. Exactly 11 of them major in STEM. b. At most 12 of them major in STEM. c. At least 11 of them major in STEM. d. Between 11 and 15 (including 11 and 15) of them major in STEM.arrow_forwardPlease solving problem2 Problem1 We consider a two-period binomial model with the following properties: each period lastsone (1) year and the current stock price is S0 = 4. On each period, the stock price doubleswhen it moves up and is reduced by half when it moves down. The annual interest rateon the money market is 25%. (This model is the same as in Prob. 1 of HW#2).We consider four options on this market: A European call option with maturity T = 2 years and strike price K = 5; A European put option with maturity T = 2 years and strike price K = 5; An American call option with maturity T = 2 years and strike price K = 5; An American put option with maturity T = 2 years and strike price K = 5.(a) Find the price at time 0 of both European options.(b) Find the price at time 0 of both American options. Compare your results with (a)and comment.(c) For each of the American options, describe the optimal exercising strategy.arrow_forwardProblem 1.We consider a two-period binomial model with the following properties: each period lastsone (1) year and the current stock price is S0 = 4. On each period, the stock price doubleswhen it moves up and is reduced by half when it moves down. The annual interest rateon the money market is 25%. We consider four options on this market: A European call option with maturity T = 2 years and strike price K = 5; A European put option with maturity T = 2 years and strike price K = 5; An American call option with maturity T = 2 years and strike price K = 5; An American put option with maturity T = 2 years and strike price K = 5.(a) Find the price at time 0 of both European options.(b) Find the price at time 0 of both American options. Compare your results with (a)and comment.(c) For each of the American options, describe the optimal exercising strategy.(d) We assume that you sell the American put to a market participant A for the pricefound in (b). Explain how you act on the market…arrow_forward
- What is the standard scores associated to the left of z is 0.1446arrow_forwardNote: The purpose of this problem below is to use computational techniques (Excelspreadsheet, Matlab, R, Python, etc.) and code the dynamic programming ideas seen inclass. Please provide the numerical answer to the questions as well as a sample of yourwork (spreadsheet, code file, etc.).We consider an N-period binomial model with the following properties: N = 60, thecurrent stock price is S0 = 1000; on each period, the stock price increases by 0.5% whenit moves up and decreases by 0.3% when it moves down. The annual interest rate on themoney market is 5%. (Notice that this model is a CRR model, which means that thebinomial tree is recombining.)(a) Find the price at time t0 = 0 of a (European) call option with strike price K = 1040and maturity T = 1 year.(b) Find the price at time t0 = 0 of a (European) put option with strike price K = 1040and maturity T = 1 year.(c) We consider now, that you are at time t5 (i.e. after 5 periods, which represents 1month later). Assume that the stock…arrow_forwardshow work in paperarrow_forward
- show all work (...or what you entered into your calculator...)arrow_forwardanswerarrow_forwardQuestion 2 The data below provides the battery life of thirty eight (38) motorcycle batteries. 100 83 83 105 110 81 114 99 101 105 78 115 74 96 106 89 94 81 106 91 93 86 79 103 94 108 113 100 117 120 77 93 93 85 76 89 78 88 680 a. Test the hypothesis that mean battery life is greater than 90. Use the 1% level of significance. b. Determine if the mean battery life is different from 80. Use the 10% level of significance. Show all steps for the hypothesis test c. Would your conlcusion in part (b) change at the 5% level of significance? | d. Confirm test results in part (b) using JASP. Note: All JASP input files and output tables should be providedarrow_forward
- Suppose that 80% of athletes at a certain college graduate. You randomly select eight athletes. What’s the chance that at most 7 of them graduate?arrow_forwardSuppose that you flip a fair coin four times. What’s the chance of getting at least one head?arrow_forwardSuppose that the chance that an elementary student eats hot lunch is 30 percent. What’s the chance that, among 20 randomly selected students, between 6 and 8 students eat hot lunch (inclusive)?arrow_forward
arrow_back_ios
SEE MORE QUESTIONS
arrow_forward_ios
Recommended textbooks for you
 Glencoe Algebra 1, Student Edition, 9780079039897...AlgebraISBN:9780079039897Author:CarterPublisher:McGraw Hill
 Big Ideas Math A Bridge To Success Algebra 1: Stu...AlgebraISBN:9781680331141Author:HOUGHTON MIFFLIN HARCOURTPublisher:Houghton Mifflin Harcourt
 Holt Mcdougal Larson Pre-algebra: Student Edition...AlgebraISBN:9780547587776Author:HOLT MCDOUGALPublisher:HOLT MCDOUGAL
Glencoe Algebra 1, Student Edition, 9780079039897...
Algebra
ISBN:9780079039897
Author:Carter
Publisher:McGraw Hill
Big Ideas Math A Bridge To Success Algebra 1: Stu...
Algebra
ISBN:9781680331141
Author:HOUGHTON MIFFLIN HARCOURT
Publisher:Houghton Mifflin Harcourt
Holt Mcdougal Larson Pre-algebra: Student Edition...
Algebra
ISBN:9780547587776
Author:HOLT MCDOUGAL
Publisher:HOLT MCDOUGAL
Hypothesis Testing using Confidence Interval Approach; Author: BUM2413 Applied Statistics UMP;https://www.youtube.com/watch?v=Hq1l3e9pLyY;License: Standard YouTube License, CC-BY
Hypothesis Testing - Difference of Two Means - Student's -Distribution & Normal Distribution; Author: The Organic Chemistry Tutor;https://www.youtube.com/watch?v=UcZwyzwWU7o;License: Standard Youtube License