(a):
The impact of free trade on the country.
(a):
Explanation of Solution
Here, in the case of the country, the domestic price was $20 and the quantity demanded and supplied was 3 million. Thus, the economy was in its initial equilibrium without trade. When free trade was allowed, the price fell to the world price of $16 and the quantity demanded increased to 4 million, whereas the quantity supplied decreased to just 1 million. This can be illustrated on the graph as follows:
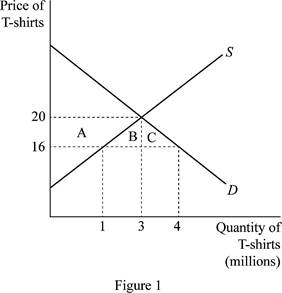
In figure 1, horizontal axis measures quantity and vertical axis measures price. The curve ‘S” and “D’ indicates
Concept introduction:
International trade: It is the trade relation between the countries.
Export: It is the process of selling domestic goods in the international market. Thus, the goods produced in the domestic firms will be sold to other foreign countries. So, it is the outflow of domestic goods and services to the foreign economy.
Import: It is the process of purchasing the foreign-made goods and services by the domestic country. Thus, it is the inflow of foreign goods and services to the domestic economy.
Sub part (b):
Change in total surplus.
Sub part (b):
Explanation of Solution
From the graph, we can easily identify that the
Thus, the increase in the consumer surplus can be calculated by adding these together as follows:
Thus, the consumer surplus increases by $14 million.
Before free trade, the
The total surplus of the economy after the trade increases by the areas of B+C, which means that the total surplus of the economy has increased by $6 million.
Concept introduction:
International trade: It is the trade relation between the countries.
Export: It is the process of selling domestic goods in the international market. Thus, the goods produced in the domestic firms will be sold to other foreign countries. So, it is the outflow of domestic goods and services to the foreign economy.
Import: It is the process of purchasing the foreign-made goods and services by the domestic country. Thus, it is the inflow of foreign goods and services to the domestic economy.
Comparative advantage: It is the ability of the country to produce the goods and services at lower opportunity costs than other countries.
Want to see more full solutions like this?

- In a paragraph, no bullet, points please answer the question and follow the instructions. Give only the solution: Use the Feynman technique throughout. Assume that you’re explaining the answer to someone who doesn’t know the topic at all. 7.Carefully explain the Fisher equation for interest rates. What insight does it provide?arrow_forwardIn a paragraph, no bullet, points please answer the question and follow the instructions. Give only the solution: Use the Feynman technique throughout. Assume that you’re explaining the answer to someone who doesn’t know the topic at all. 3. Describe the general architecture of the Federal Reserve System.arrow_forwardIn a paragraph, no bullet, points please answer the question and follow the instructions. Give only the solution: Use the Feynman technique throughout. Assume that you’re explaining the answer to someone who doesn’t know the topic at all. 1. Define money. Carefully explain the three functions of money.arrow_forward
- In a paragraph, no bullet, points please answer the question and follow the instructions. Give only the solution: Use the Feynman technique throughout. Assume that you’re explaining the answer to someone who doesn’t know the topic at all. 5.Draw the Federal Reserve System’s Balance Sheet and briefly explain each of the main (highlighted in the PowerPoints and text) components.arrow_forwardIn a paragraph, no bullet, points please answer the question and follow the instructions. Give only the solution: Use the Feynman technique throughout. Assume that you’re explaining the answer to someone who doesn’t know the topic at all. 9. What are monetary rules? How are they carried out and what is the difference between monetary rules and discretionary behavior?arrow_forwardIn a paragraph, no bullet, points please answer the question and follow the instructions. Give only the solution: Use the Feynman technique throughout. Assume that you’re explaining the answer to someone who doesn’t know the topic at all. 4. What is interest payment on reserve balances used for? How does it work?arrow_forward
- A linear programming computer package is needed. As part of the settlement for a class action lawsuit, Hoxworth Corporation must provide sufficient cash to make the following annual payments (in thousands of dollars). Year 1 2 3 4 5 6 Payment 170 195 220 265 295 440 The annual payments must be made at the beginning of each year. The judge will approve an amount that, along with earnings on its investment, will cover the annual payments. Investment of the funds will be limited to savings (at 4% annually) and government securities, at prices and rates currently quoted in The Wall Street Journal. Hoxworth wants to develop a plan for making the annual payments by investing in the following securities (par value = $1,000). Funds not invested in these securities will be placed in savings. Security Current Price Rate (%) Years to Maturity 1 $1,055 6.750 3 2 $1,000 5.125 4 Assume that interest is paid annually. The plan will be submitted to the judge and, if approved,…arrow_forwardOn the 1st of April 2018, the South African National Treasury increase the value-added tax rate from 14% to 15%. This policy change had a wide-ranging impact on society. Discuss some of the benefits and drawbacks of making use of this type of tax to generate government revenue and what we may expect in terms of its impact on inflation and GDP growth within the economy. Please use some of the economics graphs to explain some scenariosarrow_forwardEskom is South Africa’s monopoly power producer which the majority of South Africans depend on. Suppose there is extensive deregulation in the power industry. What is the impact of this deregulation on the industry? Help me on discussing the new market structure as well as the impact on supply and demand. Use the relevant diagrams.arrow_forward
- Discuss the impact of exchange rate volatility on the economy and its impact on your organisation. Make use of the relevant diagrams.arrow_forwardMacroeconomic policies have different effects on the price level and output (national income). Discuss the impact of a monetary policy that seeks to encourage economic growth.arrow_forwardCan you please help with this one. Some economists argue that taxing consumption is more efficient than taxing income. Following the same argument, the minister of finance of a country introduced a new tax for sugar based products “sugar tax” to promote healthy eating in the economy. Please use relevant diagrams to explain the impact of the tax on consumers, producers and the tax revenue when sugar is elastic and inelastic.arrow_forward

 Exploring EconomicsEconomicsISBN:9781544336329Author:Robert L. SextonPublisher:SAGE Publications, Inc
 Microeconomics: Private and Public Choice (MindTa...EconomicsISBN:9781305506893Author:James D. Gwartney, Richard L. Stroup, Russell S. Sobel, David A. MacphersonPublisher:Cengage Learning
 Macroeconomics: Private and Public Choice (MindTa...EconomicsISBN:9781305506756Author:James D. Gwartney, Richard L. Stroup, Russell S. Sobel, David A. MacphersonPublisher:Cengage Learning
 Economics: Private and Public Choice (MindTap Cou...EconomicsISBN:9781305506725Author:James D. Gwartney, Richard L. Stroup, Russell S. Sobel, David A. MacphersonPublisher:Cengage Learning