
Subpart (a):
Calculate different costs.
Subpart (a):
Explanation of Solution
Total cost (TC) can be obtained by using the following formula.
Total cost at production level 1 unit can be calculated by substituting the respective values in Equation (1).
Total cost is $105.
Average fixed cost (AFC) can be obtained by using the following formula.
Average fixed cost at production level 1 unit can be calculated by substituting the respective values in Equation (2).
Average fixed cost is $60.
Average variable cost at production level 1 unit can be calculated by substituting the respective values in Equation (3).
Average variable cost is $45.
Total average cost (AC) can be obtained by using the following formula.
Total average cost at production level 1 unit can be calculated by substituting the respective values in Equation (4).
Average variable cost is $105.
Marginal cost (MC) can be obtained by using the following formula.
Average variable cost at production level 1 unit can be calculated by substituting the respective values in Equation (5).
Marginal cost is $105.
Table-1 shows the total cost, average fixed cost, average variable cost,
Table -1
| Quantity | Fixed cost | Variable cost | TC | AFC | AVC | AC | MC |
| 0 | 60 | 0 | 60 | ||||
| 1 | 60 | 45 | 105 | 60 | 45.00 | 105.00 | 45 |
| 2 | 60 | 85 | 145 | 30 | 42.50 | 72.50 | 40 |
| 3 | 60 | 120 | 180 | 20 | 40.00 | 60.00 | 35 |
| 4 | 60 | 150 | 210 | 15 | 37.50 | 52.50 | 30 |
| 5 | 60 | 185 | 245 | 12 | 37.00 | 49.00 | 35 |
| 6 | 60 | 225 | 285 | 10 | 37.50 | 47.50 | 40 |
| 7 | 60 | 270 | 330 | 8.57 | 38.57 | 47.14 | 45 |
| 8 | 60 | 325 | 385 | 7.50 | 40.63 | 48.13 | 55 |
| 9 | 60 | 390 | 450 | 6.67 | 43.33 | 50.00 | 65 |
| 10 | 60 | 465 | 525 | 6 | 46.50 | 52.50 | 75 |
Figure -1 illustrates the shape of total fixed cost, total cost and total variable cost that influencing by the diminishing returns to scale.
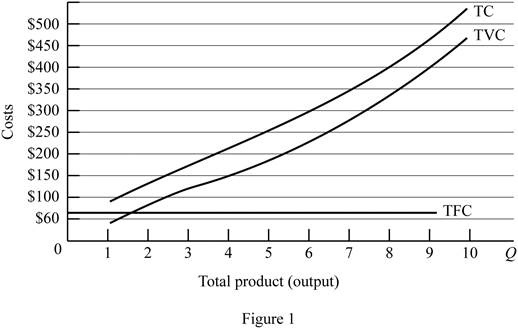
In figure -1, horizontal axis measures total output and vertical axis measures cost. The curve TC indicates total cost and the curve TVC indicates total variable cost. TFC curve indicates total fixed cost. Since total fixed cost is remain the same over the different level of production TFC curve parallel to the horizontal axis.
From the output range 1 unit to 4 units, total cost and total variable cost increasing at decreasing rate due to the increasing marginal returns. Thereafter, these two cost curves are increasing at increasing rate due to the diminishing marginal cost.
Concept introduction:
Fixed cost: Fixed costs refer to those costs that remain the same regardless of the level of production.
Variable cost: Variable cost refers to the costs that change due to the changes occurring in the level of production.
Subpart (b):
Calculate different costs.
Subpart (b):
Explanation of Solution
Figure -2 illustrates relationship between marginal cost, average variable cost, average fixed cost and average total cost curve.
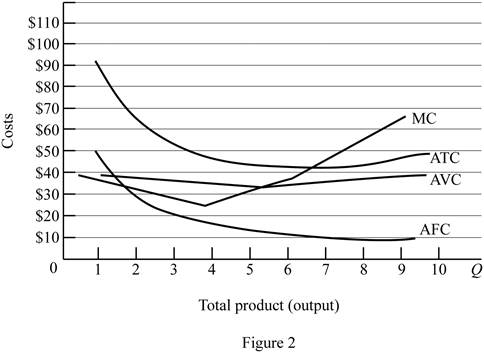
In figure -2, horizontal axis measures total output and vertical axis measures cost. The curve TC indicates total cost and the curve TVC indicates total variable cost. TFC curve indicates total fixed cost. Since total fixed cost is remain the same over the different level of production TFC curve parallel to the horizontal axis.
Since the fixed cost is spread over all the output, increasing the level of output leads to reduce the average fixed cost over the increasing production. Marginal cost curve average variable cost curve and average total cost curve are U shaped due to the operation of economies of scale and diseconomies of scale.
Average total cost curve is the vertical summation of average fixed cost and average variable cost. When the marginal cost curve is below to the average total cost curve, then the average total cost falls. When the marginal cost lies above the average total cost curve then the average total cost curve start rises. Thus, marginal cost curve intersects with the average total cost curve at the minimum point.
When the marginal cost curve is below to the average variable cost curve, then the average variable cost falls. When the marginal cost lies above the average variable cost curve then the average variable cost curve start rises. Thus, marginal cost curve intersects with the average variable cost curve at the minimum point.
Concept introduction:
Fixed cost: Fixed costs refer to those costs that remain the same regardless of the level of production.
Variable cost: Variable cost refers to the costs that change due to the changes occurring in the level of production.
Subpart (c):
Fixed cost and variable cost.
Subpart (c):
Explanation of Solution
The increasing fixed cost from $60 to $100 leads to shifts the fixed cost curve upward (By $40). This increasing fixed cost does not affect the marginal cost. Thus, marginal cost curve and average variable cost curve remains the same.
The decrease in variable cost by $10 leads to reduce the marginal cost $10 at first level of output and remains the same for other level of output. Average total cost and average variable cost decreases as a result of decrease in the variable cost. But, average fixed cost remains the same.
Concept introduction:
Fixed cost: Fixed costs refer to those costs that remain the same regardless of the level of production.
Variable cost: Variable cost refers to the costs that change due to the changes occurring in the level of production.
Want to see more full solutions like this?
Chapter 9 Solutions
EBK MICROECONOMICS

- Some economists argue that the "animal spirits" of investors are so important in determining the level of investment in the economy that interest rates do not matter at all. Part 2 a. Suppose that this were truelong dash—that investment in no way depends on interest rates. Using the line drawing tool, show what the investment curve would look like. Label the line 'I'. is my answer correct?arrow_forwardProblem 3 ABC Challenges: Attrition, Balance and Compliance Can television inform people about public affairs? Political scientists Bethany Albertson and Adria Lawrence (2009) conducted an experiment in which they randomly assigned people to treatment and control groups to evaluate the effect of watching TV on a person's information level. Those assigned to the treatment group were told to watch a specific television broadcast and were later asked questions related to what they watched. Those in the control group were not shown the TV broadcast but were asked questions related to the material in the TV broadcast. The dataset contains the following variables: • • • • • • Read News: Dummy variable which =1 if a person reads news and 0 otherwise. Political Interest: interest in political affairs (not interested=1 to very interested=4) Education: years of education Female: female dummy variable (female=1; male=0) Income: family income in thousands of dollars Information Level: information…arrow_forwardThe figure to the right gives an economy's initial aggregate demand (AD) curve. Using the line drawing tool, show an increase in aggregate demand. Properly label this line. Part 2 Note: Carefully follow the instructions above and only draw the required object. Part 3 Which of the following will generate an increase in aggregate demand? A. A decrease in the price level. B. A decrease in the money supply. C. Increased government expenditures for war. D. A tax increase.arrow_forward
- Problem 2 Experiments/Randomized Control Trial Suppose you are interested in studying the effect of academic counselling on the years it takes for a student to obtain an undergraduate degree. You conduct a randomized control trial to answer the question. You randomly assign 2500 individuals in a university in New York to receive academic counselling and 2500 students to not receive any academic counselling. a. Which people are a part of the treatment group and which people are a part of the control group? (5 points) b. What regression will you run? Define the variables where required. (5 points) Λ c. Suppose you estimate ß₁ = -0.3. Interpret it. (5 points) 1 d. You test for balance using the variables mentioned in the table below. Based on the results do you think that the treatment and control group are balanced? If your answer is "yes" then explain why. If your answer is "no", then explain why and mention how will you address the issue of imbalance. (10 points) Variable GPA Average…arrow_forwardProblem 1 Experiments/Randomized Control Trial Suppose you are interested in studying the effect of being a part of the labor union on an individual's hourly wage. You collect data on 1000 people and run the following regression. Wage=Bo+B₁Labor Union; + &¿ where Labor Union is a dummy variable which is equal t to 1 for people who are a part of labor union and 0 for others. a. Suppose you estimate b. Do you think B₁ = 1.6. Interpret B₁ (5 points) 1 1 is biased or unbiased? Explain. (5 points) Now suppose you conduct a randomized control trial to answer the same question. You randomly assign some individuals to be a part of the labor union and others to not be a part of the labor union. The first step you take is to ensure that the randomization was done correctly. Then you estimate the following equation: = Wage, Bo+B₁Treatment; + &; Treatment =1 if the student is assigned to be a part of Labor Union Treatment=0 if the student is assigned to not be a part of Labor Union c. Why is it…arrow_forwardThe figure to the right contains a point indicating the economy's initial price and aggregate output (Upper P 0P0,Upper Y 0Y0) combination. Suppose that the price level rises such that P Subscript 1 > P Subscript 0. Using the point drawing tool, identify a potential location for the economy's new price and aggregate output (Upper P 1P1,Upper Y 1Y1) combination. Label this point B. Using the line drawing tool, draw the aggregate demand curve through these points. Properly label the line. picture is attachedarrow_forward
- Question content area left Part 1 The figure to the right gives an economy's initial aggregate demand (AD) curve. Using the line drawing tool, show a decrease in aggregate demand. Properly label this line. Part 2 Note: Carefully follow the instructions above and only draw the required object. Part 3 Which of the following will generate a decrease in aggregate demand? A. Increased government expenditures for infrastructure. B. A tax increase. C. An increase in the price level. D. An increase in the money supply.arrow_forwardA movie theater is showing two different movies: a Hollywood blockbuster (with 100 customers willing to pay $10 for a ticket, and 100 willing to pay $8) and an independent film that attracts 50 film buffs, willing to pay $20 each. Marginal costs are zero and neither movie can fill theater capacity. What is the theater's maximum profit if it cannot price discriminate (it must charge the same price for both movies) and if it can price discriminate (it may charge different prices for different movies)? a. $2,000; $2,600 b. $1,500; $2,100 c. $1,500; $2,000arrow_forwardA movie theater is showing two different movies: a Hollywood blockbuster (with 100 customers willing to pay $10 for a ticket, and 100 willing to pay $8) and an independent film that attracts 50 film buffs, willing to pay $20 each. Marginal costs are zero and neither movie can fill theater capacity. What is the theater's maximum profit if it cannot price discriminate (it must charge the same price for both movies) and if it can price discriminate (it may charge different prices for different movies)? a. $2,000; $2,600 b. $1,500; $2,100 c. $1,500; $2,000arrow_forward
- What profi is most important in business ?arrow_forward5. Download the Excel sheet from Brightspace. The data contains the GDP per capita and GNI per capita of OECD member countries in 2014 (both figures are reported in US dollars). The countries are ranked by GDP per capita. a. Compute the ratio of GNI to GDP for each country (GNI per capita/GDP per capita). What does this imply about net factor income from abroad for each country? b. Rank the countries based on the GNI/GDP ratio, starting with the country with the highest ratio and ending with the country with the lowest ratio. Which country has the highest ratio, and which has the lowest? c. Comment on why the countries you identified in the previous question have a large difference between GDP and GNI? What does the difference imply?arrow_forward3. Answer the following questions about external wealth. a. Home has external wealth of $100 million in period t. In t+1, Home purchases $160 million foreign assets, and Foreign purchases $120 million in Home assets. Assume a world interest rate of 10% per annum. Compute the "change" in external wealth at t+1 for Home. b. A country's external wealth was -$1.5 billion at the end of 2015, and its trade balance was $750 million in 2016. Assume the world interest rate is 5% per annum. What is the "value" of a country's external wealth at the end of 2016?arrow_forward

 Economics (MindTap Course List)EconomicsISBN:9781337617383Author:Roger A. ArnoldPublisher:Cengage Learning

 Principles of MicroeconomicsEconomicsISBN:9781305156050Author:N. Gregory MankiwPublisher:Cengage Learning