
Subpart (a):
Calculate different costs.
Subpart (a):
Explanation of Solution
Total cost (TC) can be obtained by using the following formula.
Total cost at production level 1 unit can be calculated by substituting the respective values in Equation (1).
Total cost is $105.
Average fixed cost (AFC) can be obtained by using the following formula.
Average fixed cost at production level 1 unit can be calculated by substituting the respective values in Equation (2).
Average fixed cost is $60.
Average variable cost at production level 1 unit can be calculated by substituting the respective values in Equation (3).
Average variable cost is $45.
Total average cost (AC) can be obtained by using the following formula.
Total average cost at production level 1 unit can be calculated by substituting the respective values in Equation (4).
Average variable cost is $105.
Marginal cost (MC) can be obtained by using the following formula.
Average variable cost at production level 1 unit can be calculated by substituting the respective values in Equation (5).
Marginal cost is $105.
Table-1 shows the total cost, average fixed cost, average variable cost,
Table -1
| Quantity | Fixed cost | Variable cost | TC | AFC | AVC | AC | MC |
| 0 | 60 | 0 | 60 | ||||
| 1 | 60 | 45 | 105 | 60 | 45.00 | 105.00 | 45 |
| 2 | 60 | 85 | 145 | 30 | 42.50 | 72.50 | 40 |
| 3 | 60 | 120 | 180 | 20 | 40.00 | 60.00 | 35 |
| 4 | 60 | 150 | 210 | 15 | 37.50 | 52.50 | 30 |
| 5 | 60 | 185 | 245 | 12 | 37.00 | 49.00 | 35 |
| 6 | 60 | 225 | 285 | 10 | 37.50 | 47.50 | 40 |
| 7 | 60 | 270 | 330 | 8.57 | 38.57 | 47.14 | 45 |
| 8 | 60 | 325 | 385 | 7.50 | 40.63 | 48.13 | 55 |
| 9 | 60 | 390 | 450 | 6.67 | 43.33 | 50.00 | 65 |
| 10 | 60 | 465 | 525 | 6 | 46.50 | 52.50 | 75 |
Figure -1 illustrates the shape of total fixed cost, total cost and total variable cost that influencing by the diminishing returns to scale.
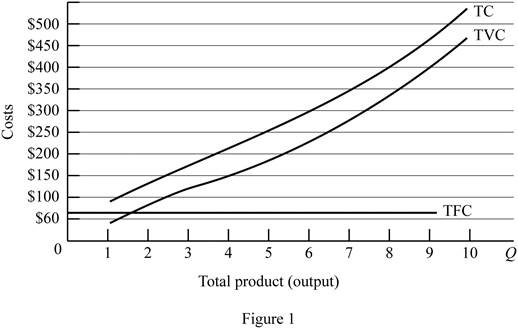
In figure -1, horizontal axis measures total output and vertical axis measures cost. The curve TC indicates total cost and the curve TVC indicates total variable cost. TFC curve indicates total fixed cost. Since total fixed cost is remain the same over the different level of production TFC curve parallel to the horizontal axis.
From the output range 1 unit to 4 units, total cost and total variable cost increasing at decreasing rate due to the increasing marginal returns. Thereafter, these two cost curves are increasing at increasing rate due to the diminishing marginal cost.
Concept introduction:
Fixed cost: Fixed costs refer to those costs that remain the same regardless of the level of production.
Variable cost: Variable cost refers to the costs that change due to the changes occurring in the level of production.
Subpart (b):
Calculate different costs.
Subpart (b):
Explanation of Solution
Figure -2 illustrates relationship between marginal cost, average variable cost, average fixed cost and average total cost curve.
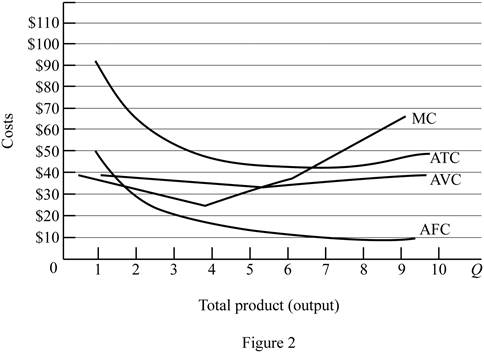
In figure -2, horizontal axis measures total output and vertical axis measures cost. The curve TC indicates total cost and the curve TVC indicates total variable cost. TFC curve indicates total fixed cost. Since total fixed cost is remain the same over the different level of production TFC curve parallel to the horizontal axis.
Since the fixed cost is spread over all the output, increasing the level of output leads to reduce the average fixed cost over the increasing production. Marginal cost curve average variable cost curve and average total cost curve are U shaped due to the operation of economies of scale and diseconomies of scale.
Average total cost curve is the vertical summation of average fixed cost and average variable cost. When the marginal cost curve is below to the average total cost curve, then the average total cost falls. When the marginal cost lies above the average total cost curve then the average total cost curve start rises. Thus, marginal cost curve intersects with the average total cost curve at the minimum point.
When the marginal cost curve is below to the average variable cost curve, then the average variable cost falls. When the marginal cost lies above the average variable cost curve then the average variable cost curve start rises. Thus, marginal cost curve intersects with the average variable cost curve at the minimum point.
Concept introduction:
Fixed cost: Fixed costs refer to those costs that remain the same regardless of the level of production.
Variable cost: Variable cost refers to the costs that change due to the changes occurring in the level of production.
Subpart (c):
Fixed cost and variable cost.
Subpart (c):
Explanation of Solution
The increasing fixed cost from $60 to $100 leads to shifts the fixed cost curve upward (By $40). This increasing fixed cost does not affect the marginal cost. Thus, marginal cost curve and average variable cost curve remains the same.
The decrease in variable cost by $10 leads to reduce the marginal cost $10 at first level of output and remains the same for other level of output. Average total cost and average variable cost decreases as a result of decrease in the variable cost. But, average fixed cost remains the same.
Concept introduction:
Fixed cost: Fixed costs refer to those costs that remain the same regardless of the level of production.
Variable cost: Variable cost refers to the costs that change due to the changes occurring in the level of production.
Want to see more full solutions like this?
Chapter 9 Solutions
ECO 2010 INCLUSIVE ACCESS

- Consider two assets with the following returns: State Prob. of state R₁ R2 1 23 13 25% 5% 2 -10% 1% Compute the optimal portfolio for an investor having a Bernoulli utility of net returns u(r) = 2√√r+ 10. Compute the certainty equivalent of the optimal portfolio. Do the results change if short-selling is not allowed? If so, how?arrow_forwardIn the graph at the right, the average variable cost is curve ☐. The average total cost is curve marginal cost is curve The C Cost per Unit ($) Per Unit Costs A 0 Output Quantity Barrow_forwardWhat are some of the question s that I can ask my economic teacher?arrow_forward
- Answer question 2 only.arrow_forward1. A pension fund manager is considering three mutual funds. The first is a stock fund, the second is a long-term government and corporate fund, and the third is a (riskless) T-bill money market fund that yields a rate of 8%. The probability distributions of the risky funds have the following characteristics: Standard Deviation (%) Expected return (%) Stock fund (Rs) 20 30 Bond fund (RB) 12 15 The correlation between the fund returns is .10.arrow_forwardFrederick Jones operates a sole proprietorship business in Trinidad and Tobago. His gross annual revenue in 2023 was $2,000,000. He wants to register for VAT, but he is unsure of what VAT entails, the requirements for registration and what he needs to do to ensure that he is fully compliant with VAT regulations. Make reference to the Vat Act of Trinidad and Tobago and explain to Mr. Jones what VAT entails, the requirements for registration and the requirements to be fully compliant with VAT regulations.arrow_forward
- Sue is a sole proprietor of her own sewing business. Revenues are $150,000 per year and raw material (cloth, thread) costs are $130,000 per year. Sue pays herself a salary of $60,000 per year but gave up a job with a salary of $80,000 to run the business. ○ A. Her accounting profits are $0. Her economic profits are - $60,000. ○ B. Her accounting profits are $0. Her economic profits are - $40,000. ○ C. Her accounting profits are - $40,000. Her economic profits are - $60,000. ○ D. Her accounting profits are - $60,000. Her economic profits are -$40,000.arrow_forwardSelect a number that describes the type of firm organization indicated. Descriptions of Firm Organizations: 1. has one owner-manager who is personally responsible for all aspects of the business, including its debts 2. one type of partner takes part in managing the firm and is personally liable for the firm's actions and debts, and the other type of partner takes no part in the management of the firm and risks only the money that they have invested 3. owners are not personally responsible for anything that is done in the name of the firm 4. owned by the government but is usually under the direction of a more or less independent, state-appointed board 5. established with the explicit objective of providing goods or services but only in a manner that just covers its costs 6. has two or more joint owners, each of whom is personally responsible for all of the partnership's debts Type of Firm Organization a. limited partnership b. single proprietorship c. corporation Correct Numberarrow_forwardThe table below provides the total revenues and costs for a small landscaping company in a recent year. Total Revenues ($) 250,000 Total Costs ($) - wages and salaries 100,000 -risk-free return of 2% on owner's capital of $25,000 500 -interest on bank loan 1,000 - cost of supplies 27,000 - depreciation of capital equipment 8,000 - additional wages the owner could have earned in next best alternative 30,000 -risk premium of 4% on owner's capital of $25,000 1,000 The economic profits for this firm are ○ A. $83,000. B. $82,500. OC. $114,000. OD. $83,500. ○ E. $112,500.arrow_forward

 Economics (MindTap Course List)EconomicsISBN:9781337617383Author:Roger A. ArnoldPublisher:Cengage Learning


 Principles of Economics 2eEconomicsISBN:9781947172364Author:Steven A. Greenlaw; David ShapiroPublisher:OpenStax