Concept explainers
Videos
Ethical Behavior of Business Students at Bayview University
During the global recession of 2008 and 2009, there were many accusations of unethical behavior by Wall Street executives, financial managers, and other corporate officers. At that time, an article appeared that suggested that part of the reason for such unethical business behavior may stem from the fact that cheating has become more prevalent among business students (Chronicle of Higher Education, February 10, 2009). The article reported that 56% of business students admitted to cheating at some time during their academic career as compared to 47% of nonbusiness students.
Cheating has been a concern of the dean of the College of Business at Bayview University for several years. Some faculty members in the college believe that cheating is more widespread at Bayview than at other universities, while other faculty members think that cheating is not a major problem in the college. To resolve some of these issues, the dean commissioned a study to assess the current ethical behavior of business students at Bay-view. As part of this study, an anonymous exit survey was administered to a sample of 90 business students from this year’s graduating class. Responses to the following questions were used to obtain data regarding three types of cheating.
During your time at Bayview, did you ever present work copied off the Internet as your own?
Yes ______ No ______
During your time at Bayview, did you ever copy answers off another student’s exam?
Yes ________ No _______
During your time at Bayview, did you ever collaborate with other students on projects that were supposed to be completed individually?
Yes ________ No _______
Any student who answered Yes to one or more of these questions was considered to have been involved in some type of cheating. A portion of the data collected follows. The complete data set is in the file named Bayview.
| Student | Copied from Internet | Copied on Exam | Collaborated on Individual project | Gender |
| 1 | No | No | No | Female |
| 2 | No | No | No | Male |
| 3 | Yes | No | Yes | Male |
| 4 | Yes | Yes | No | Male |
| 5 | No | No | Yes | Male |
| 6 | Yes | No | No | Female |
| . | . | . | . | . |
| . | . | . | . | . |
| 88 | No | No | No | Male |
| 89 | No | Yes | Yes | Male |
| 90 | No | No | No | Female |
Managerial Report
Prepare a report for the dean of the college that summarizes your assessment of the nature of cheating by business students at Bayview University. Be sure to include the following items in your report.
- 1. Use
descriptive statistics to summarize the data and comment on your findings. - 2. Develop 95% confidence intervals for the proportion of all students, the proportion of male students, and the proportion of female students who were involved in some type of cheating.
- 3. Conduct a hypothesis test to determine if the proportion of business students at Bayview University who were involved in some type of cheating is less than that of business students at other institutions as reported by the Chronicle of Higher Education.
- 4. Conduct a hypothesis test to determine if the proportion of business students at Bay-view University who were involved in some form of cheating is less than that of non-business students at other institutions as reported by the Chronicle of higher Education.
- 5. What advice would you give to the dean based upon your analysis of the data?
1.
Summarize the data and comment on your findings using the descriptive statistics.
Answer to Problem 2CP
The percentage of males is greater in Copied from Internet, Copied on Exam, and Collaborated on Individual Project compared to females.
Explanation of Solution
Calculation:
The given data is based on the assessment of the nature of cheating by a business student at Bayview University.
Software procedure:
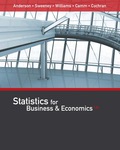
A step-by-step procedure to construct a contingency table or cross table for gender and Copied from Internet using MINITAB software given below:
- Choose stat > tables>cross tabulation and chi square.
- Choose raw data (summarized).
- In rows, enter the column of Gender.
- In columns, enter the column of Copied from Internet.
- Under display, select count
- Click OK
Output using MINITAB software is given below:
Software procedure:
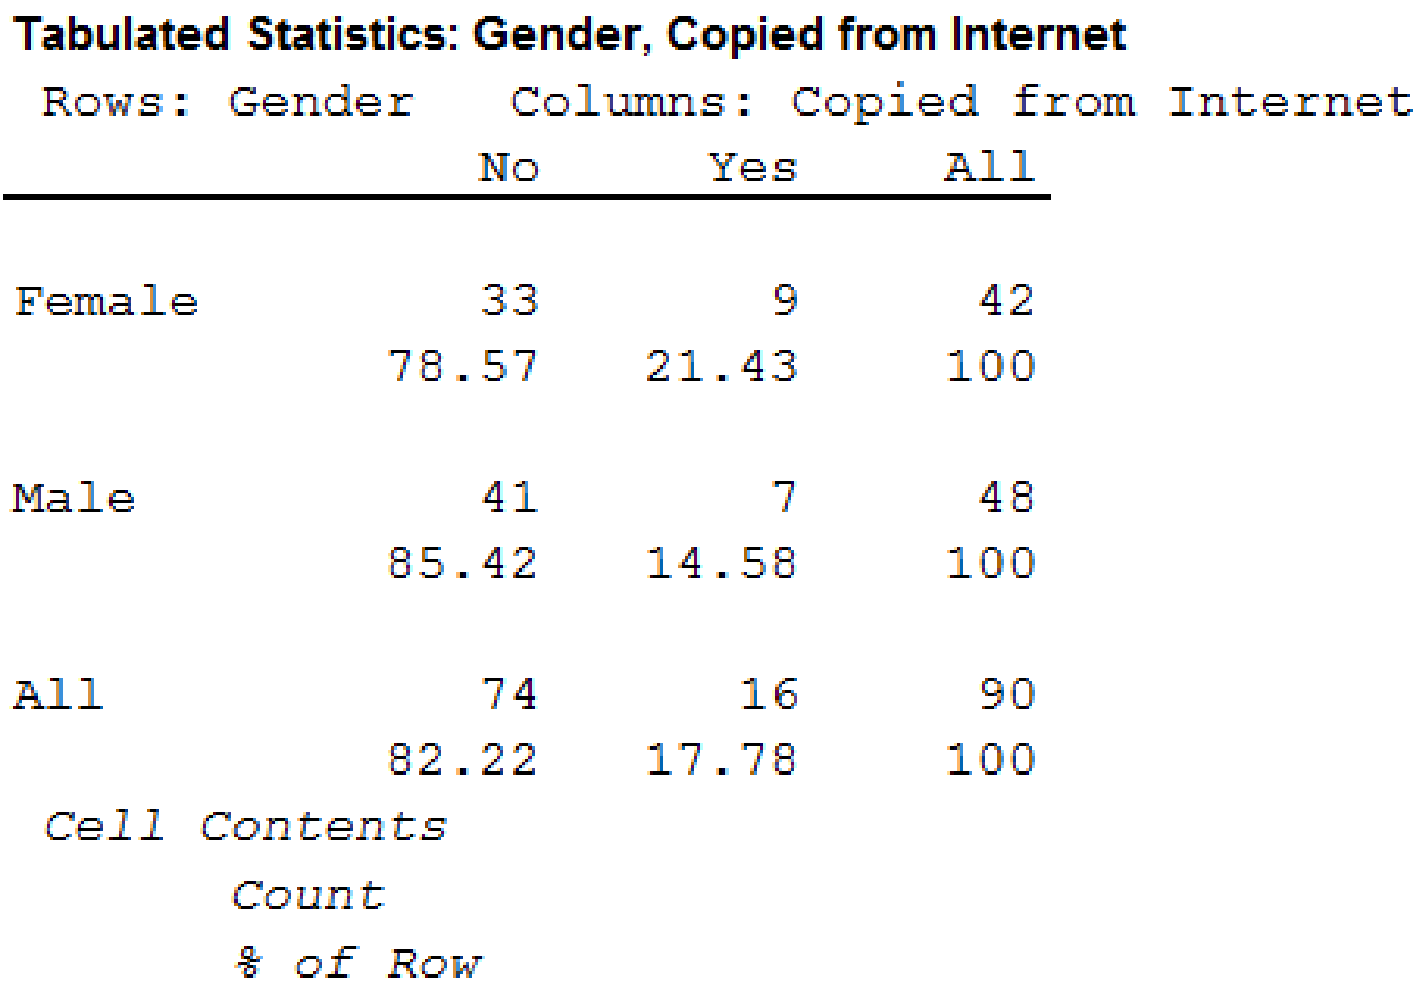
A step-by-step procedure to construct a contingency table or cross table for gender and Copied on Exam using MINITAB software given below:
- Choose stat > tables>cross tabulation and chi square.
- Choose raw data (summarized).
- In rows, enter the column of Gender.
- In columns, enter the column of Copied on Exam.
- Under display, select count
- Click OK
Output using MINITAB software is given below:
Software procedure:
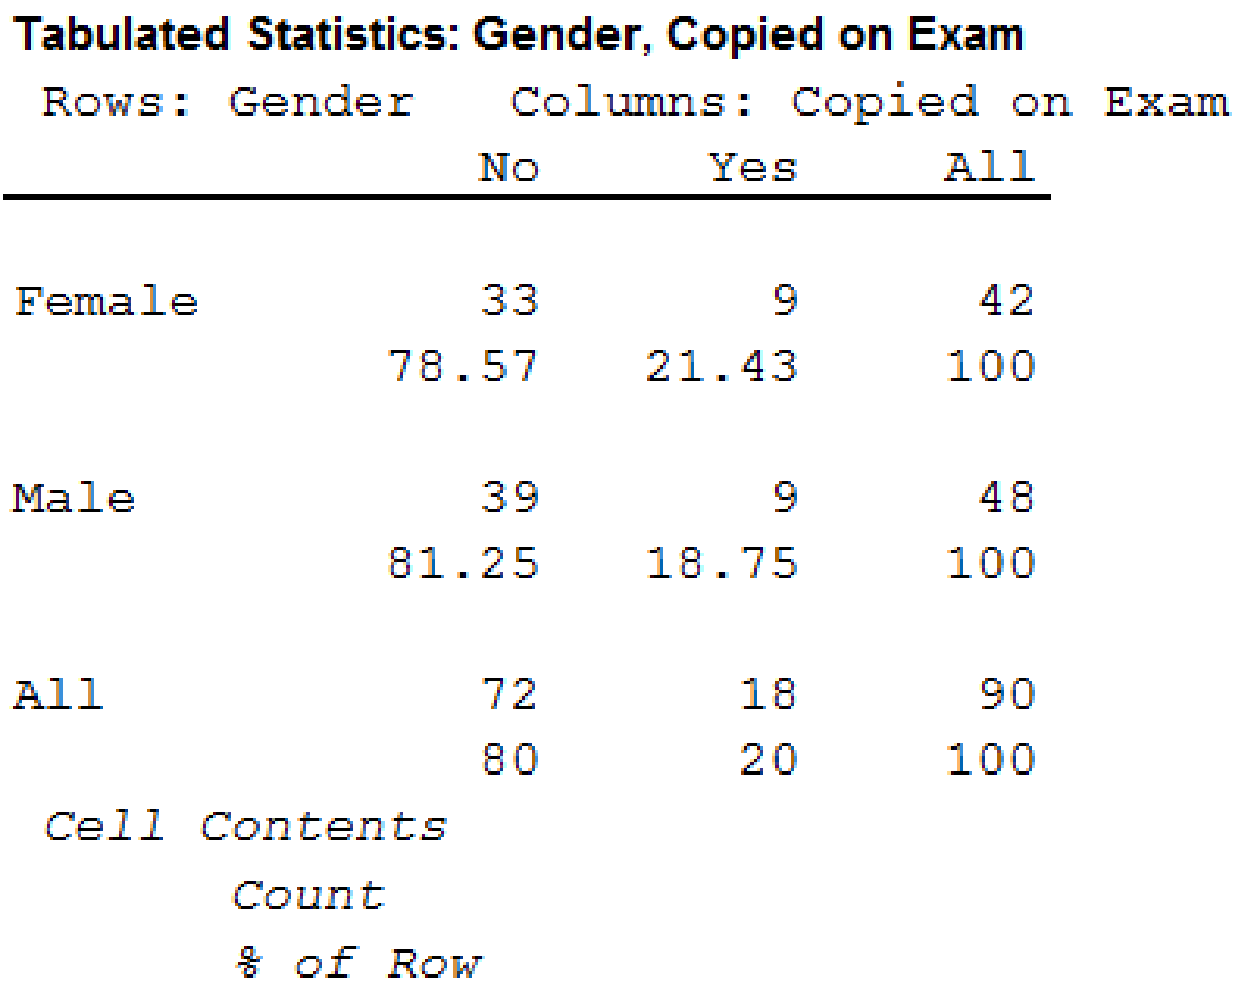
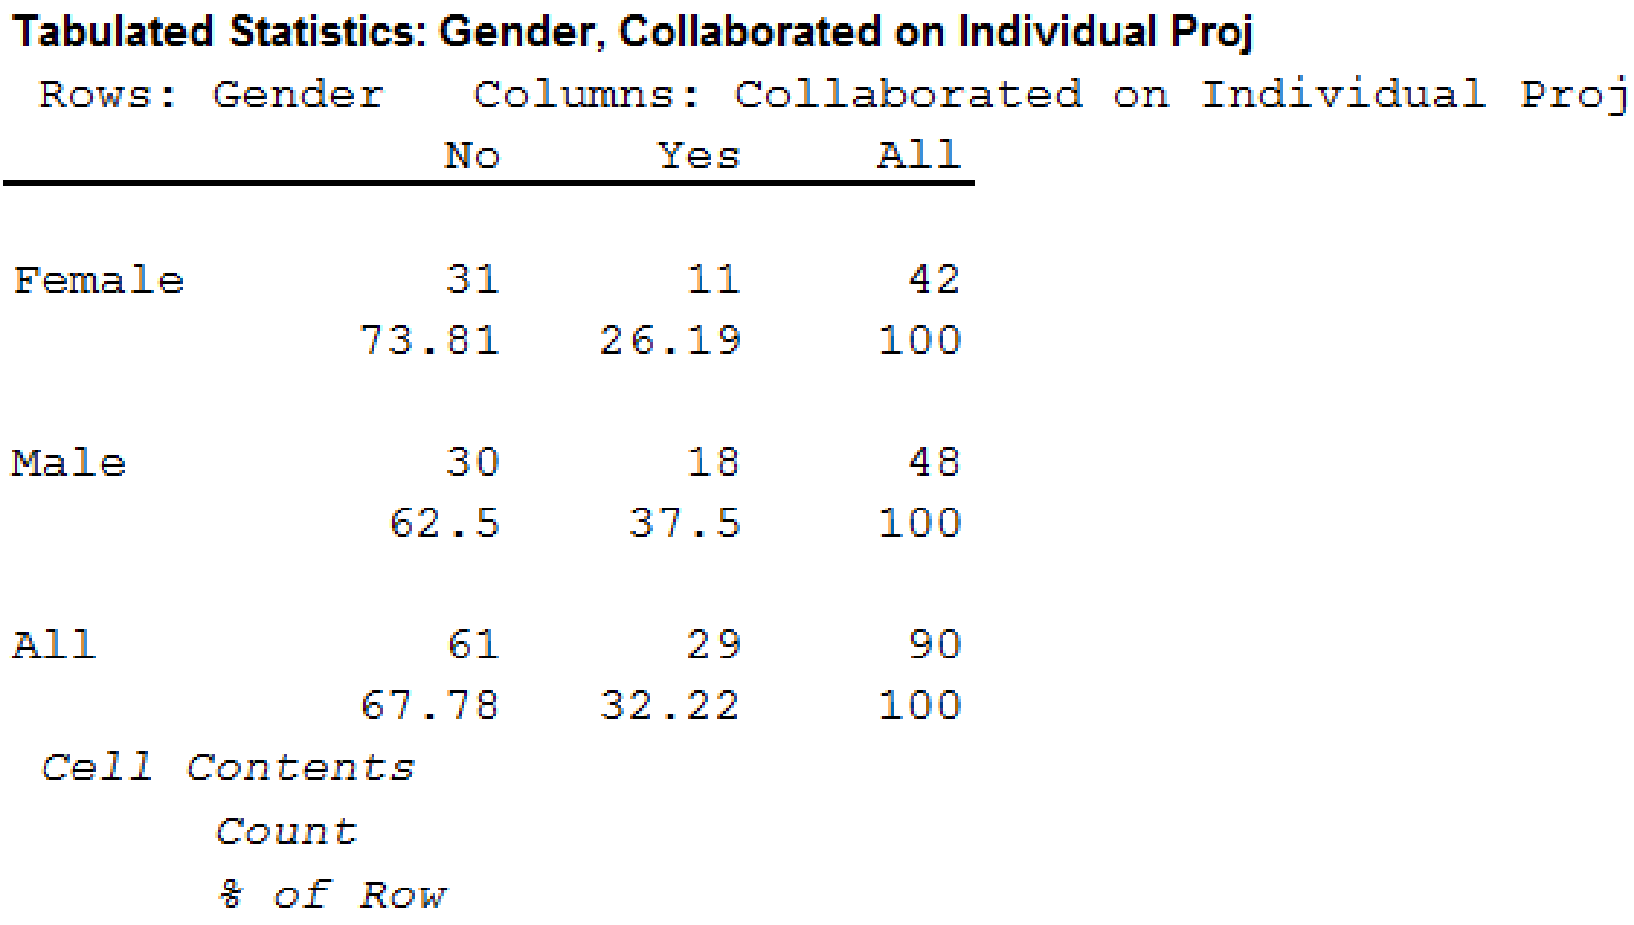
A step-by-step procedure to construct a contingency table or cross table for gender and Collaborated on Individual Project using MINITAB software given below:
- Choose stat > tables>cross tabulation and chi square.
- Choose raw data (summarized).
- In rows, enter the column of Gender.
- In columns, enter the column of Collaborated on Individual Project.
- Under display, select count
- Click OK
Output using MINITAB software is given below:
From the results, the summary table for all students who were involved in type of cheating is shown below:
| Copied from Internet | Copied on Exam | Collaborated on Individual Project | Overall Cheated | |||||
| Count | % | Count | % | Count | % | Count | % | |
| Yes | 16 | 17.778 | 18 | 20 | 29 | 32.222 | 37 | 41.111 |
| No | 74 | 82.222 | 72 | 80 | 61 | 67.778 | 53 | 58.889 |
| 90 | 100 | 90 | 100 | 90 | 100 | 90 | 100 | |
From the results, the summary table for male students who were involved in type of cheating is shown below:
| Copied from Internet | Copied on Exam | Collaborated on Individual Project | Overall Cheated | |||||
| Count | % | Count | % | Count | % | Count | % | |
| Yes | 7 | 14.583 | 9 | 18.75 | 18 | 37.5 | 21 | 43.75 |
| No | 41 | 85.417 | 39 | 81.25 | 30 | 62.5 | 27 | 56.25 |
| 48 | 100 | 48 | 100 | 48 | 100 | 48 | 100 | |
From the results, the summary table for female students who were involved in type of cheating is shown below:
| Copied from Internet | Copied on Exam | Collaborated on Individual Project | Overall Cheated | |||||
| Count | % | Count | % | Count | % | Count | % | |
| Yes | 9 | 21.428 | 9 | 21.428 | 11 | 26.190 | 16 | 38.095 |
| No | 33 | 78.571 | 33 | 78.571 | 31 | 73.810 | 26 | 61.905 |
| 42 | 100 | 42 | 100 | 42 | 100 | 42 | 100 | |
Observation:
From the MINITAB output, the percentage of males is greater in Copied from Internet, Copied on Exam, and Collaborated on Individual Project compared to females.
2.
Find the 95% confidence intervals for the proportion of all students who were involved in some type of cheating.
Find the 95% confidence intervals for the proportion of male students who were involved in some type of cheating.
Find the 95% confidence intervals for the proportion of female students who were involved in some type of cheating.
Answer to Problem 2CP
The 95% confidence intervals for the proportion of all students who were involved in some type of cheating is
The 95% confidence intervals for the proportion of male students who were involved in some type of cheating is
The 95% confidence intervals for the proportion of female students who were involved in some type of cheating is
Explanation of Solution
Calculation:
Confidence interval:
Software Procedure:
A step-by-step procedure to obtain the confidence interval using MINITAB software:
- Choose Stat > Basic Statistics > 1 Proportion.
- Choose Summarized data.
- In Number of events, enter 37. In Number of trials, enter 90.
- Check Options; enter Confidence level as 95%.
- Choose not equal in alternative.
- Click OK.
Output using MINITAB software is given below:
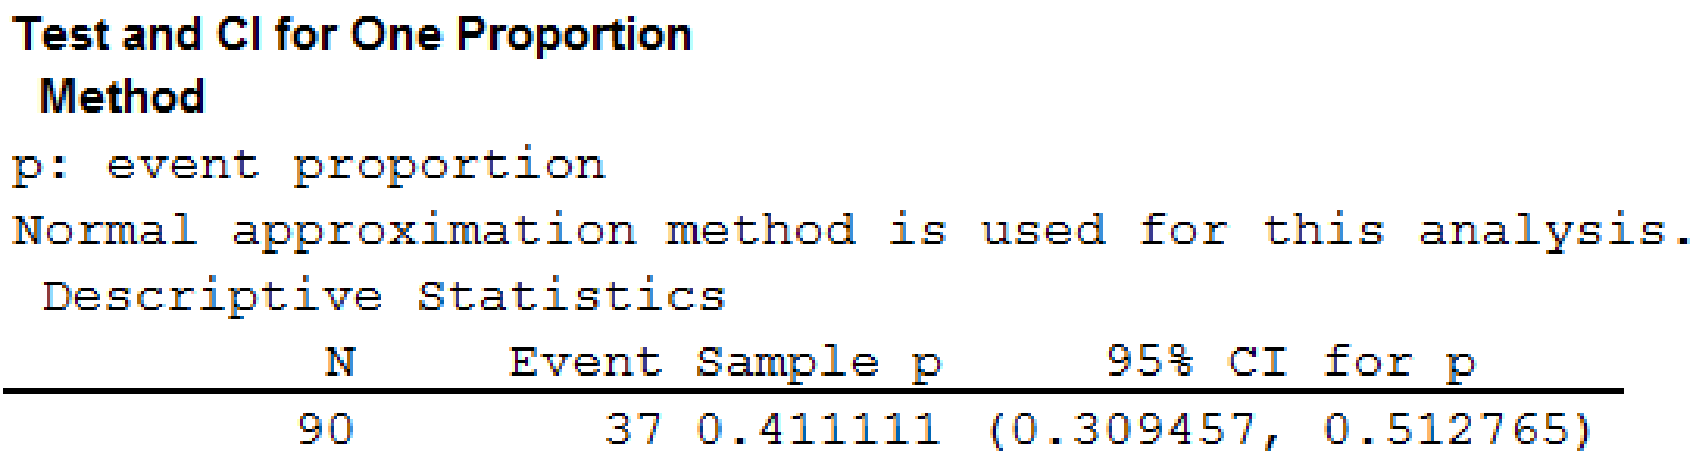
From the output, the 95% confidence intervals for the proportion of all students who were involved in some type of cheating is
Confidence interval:
Software Procedure:
A step-by-step procedure to obtain the confidence interval using MINITAB software:
- Choose Stat > Basic Statistics > 1 Proportion.
- Choose Summarized data.
- In Number of events, enter 21. In Number of trials, enter 48.
- Check Options; enter Confidence level as 95%.
- Choose not equal in alternative.
- Click OK.
Output using MINITAB software is given below:
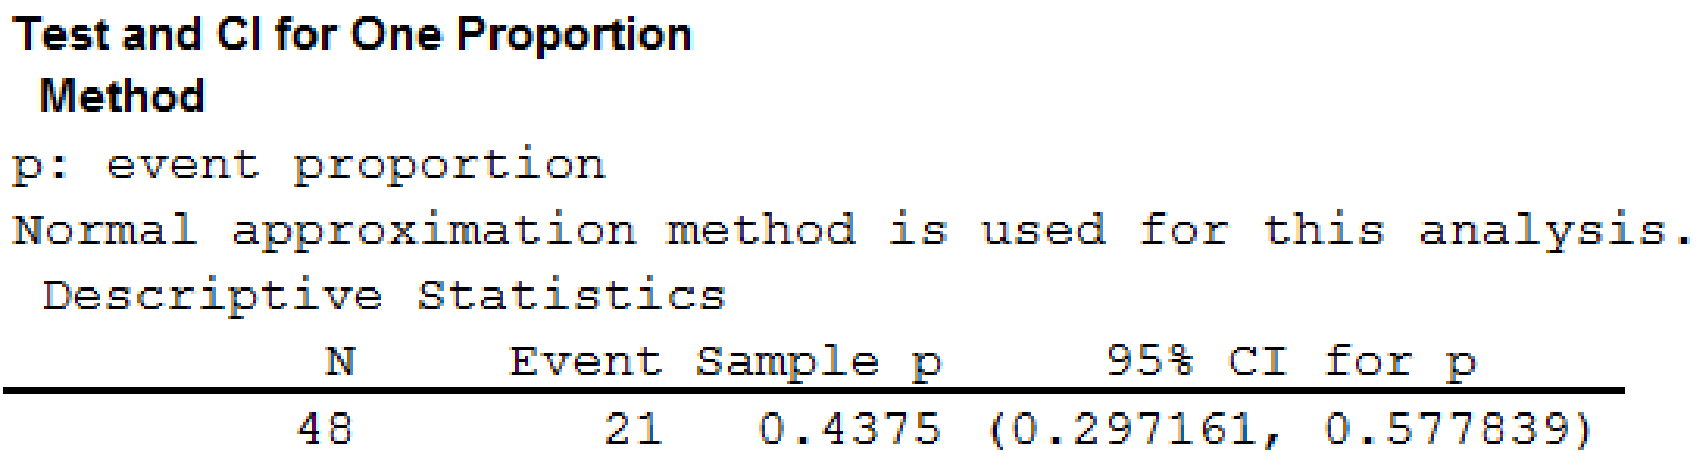
From the output, the 95% confidence intervals for the proportion of male students who were involved in some type of cheating is
Confidence interval:
Software Procedure:
A step-by-step procedure to obtain the confidence interval using MINITAB software:
- Choose Stat > Basic Statistics > 1 Proportion.
- Choose Summarized data.
- In Number of events, enter 16. In Number of trials, enter 42.
- Check Options; enter Confidence level as 95%.
- Choose not equal in alternative.
- Click OK.
Output using MINITAB software is given below:
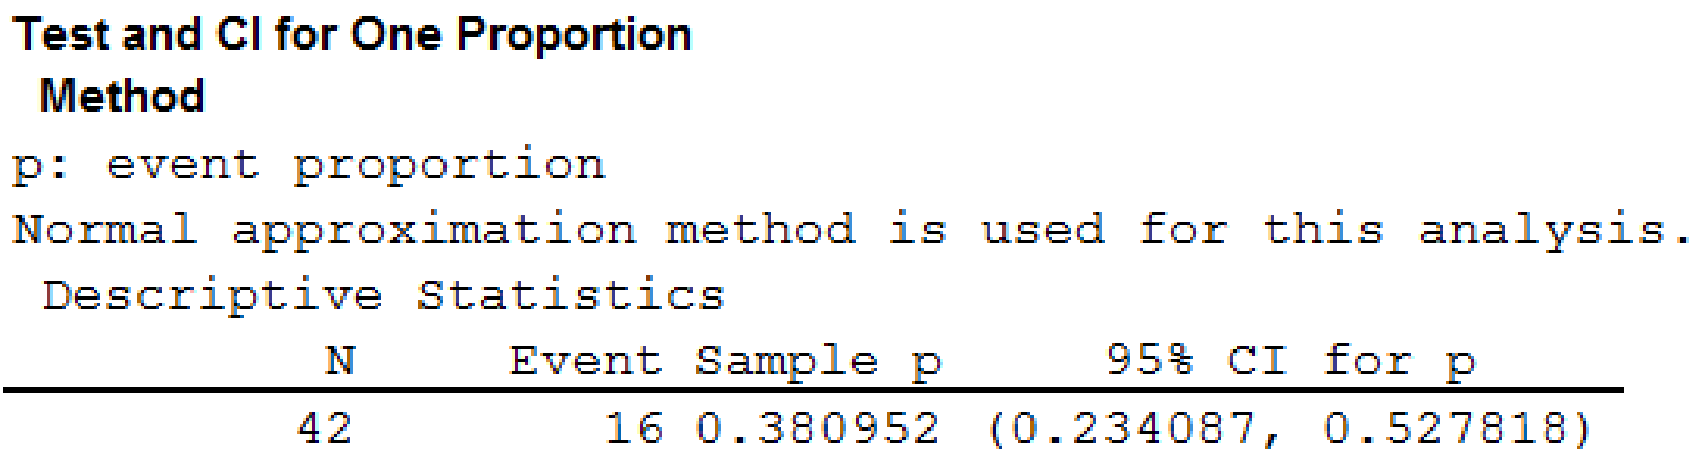
From the output, the 95% confidence intervals for the proportion of female students who were involved in some type of cheating is
3.
Check whether the proportion of business students at Bayview University who were involved in some type of cheating is less than that of business students at other institutions as reported by the Chronicle of Higher Education.
Answer to Problem 2CP
The conclusion is that the proportion of business students at Bayview University who were involved in some type of cheating is less than that of business students at other institutions as reported by the Chronicle of Higher Education.
Explanation of Solution
Calculation:
The null and alternative hypotheses are given below:
Null hypothesis:
Alternative hypothesis:
Software Procedure:
A step-by-step procedure to obtain the p-value using MINITAB software:
- Choose Stat > Basic Statistics > 1 Proportion.
- Choose Summarized data.
- In Number of events, enter 37. In Number of trials, enter 90.
- In Perform hypothesis test, enter the test proportion as 0.56.
- Check Options; enter Confidence level as 95%.
- Choose less than in alternative.
- Click OK.
Output using MINITAB software is given below:
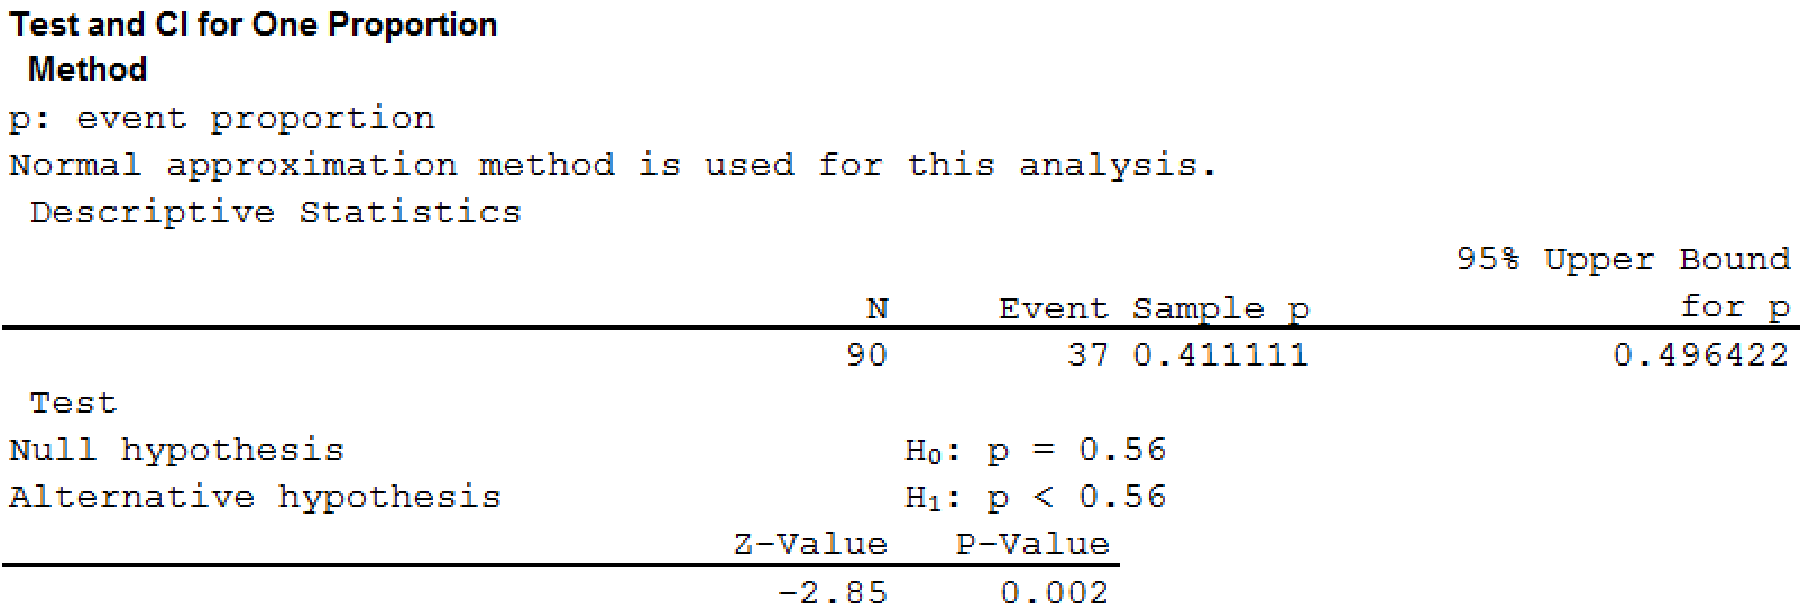
From the output, the p-value is 0.002.
Rejection rule:
If
If
Conclusion:
Here, the p-value is less than the level of significance.
That is,
By the rejection rule, the null hypothesis is rejected.
Hence, the proportion of business students at Bayview University who were involved in some type of cheating is less than that of business students at other institutions as reported by the Chronicle of Higher Education.
4.
Check whether the proportion of business students at Bayview University who were involved in some form of cheating is less than that of non-business students at other institutions as reported by the Chronicle of Higher Education.
Answer to Problem 2CP
The conclusion is that the proportion of business students at Bayview University who were involved in some form of cheating is not less than that of non-business students at other institutions as reported by the Chronicle of Higher Education.
Explanation of Solution
Calculation:
The null and alternative hypotheses most appropriate for this situation are shown below:
Null hypothesis:
Alternative hypothesis:
Software Procedure:
A step-by-step procedure to obtain the p-value using MINITAB software:
- Choose Stat > Basic Statistics > 1 Proportion.
- Choose Summarized data.
- In Number of events, enter 37. In Number of trials, enter 90.
- In Perform hypothesis test, enter the test proportion as 0.47.
- Check Options; enter Confidence level as 95%.
- Choose less than in alternative.
- Click OK.
Output using MINITAB software is given below:
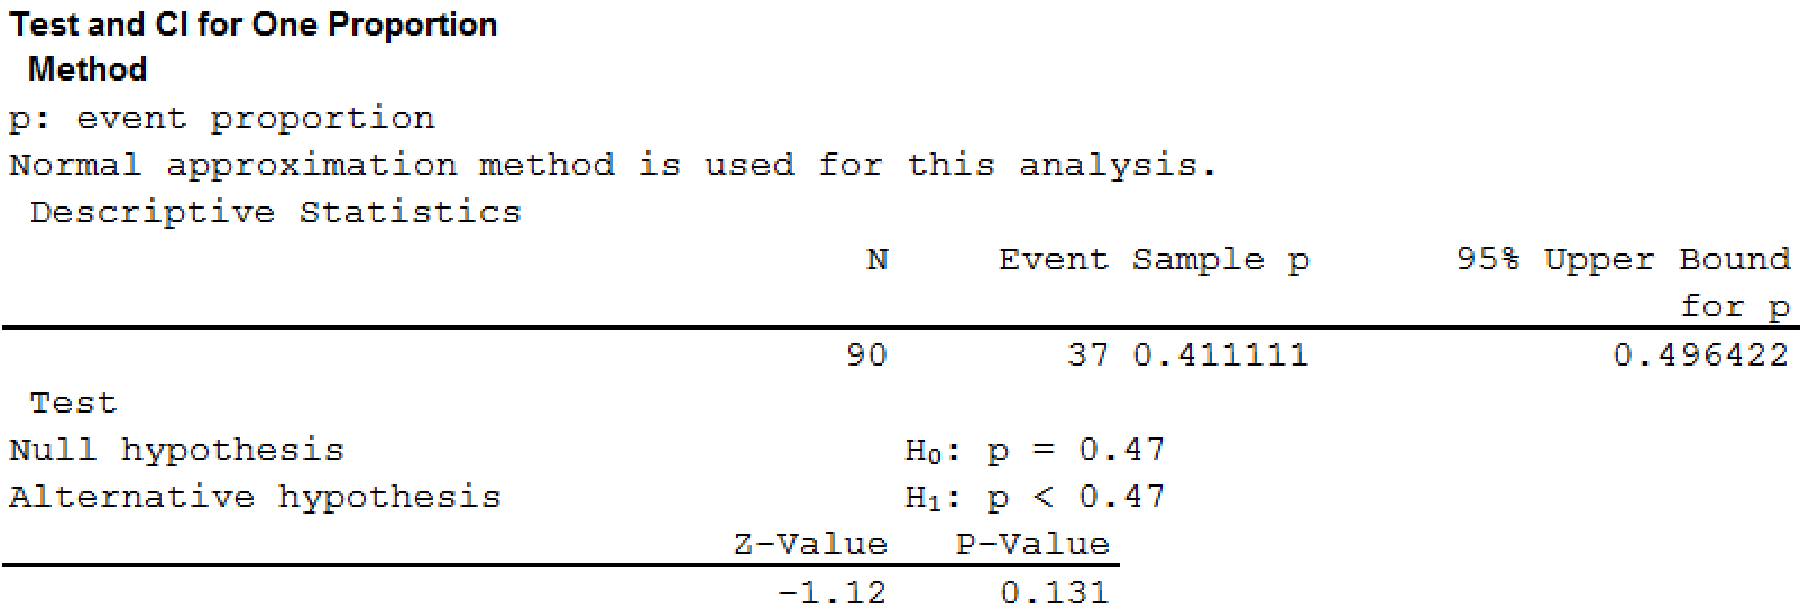
From the output, the p-value is 0.131.
Rejection rule:
If
If
Conclusion:
Here, the p-value is greater than the level of significance.
That is,
By the rejection rule, the null hypothesis is not rejected.
Hence, the proportion of business students at Bayview University who were involved in some form of cheating is not less than that of non-business students at other institutions as reported by the Chronicle of Higher Education.
5.
Find the advice that you give to the dean based upon your analysis of the data.
Explanation of Solution
From the results, it can be observed that the business students at Bayview University who were involved in some form of cheating are higher when compared to the non-business students. Hence, the dean identifies the reason that the student cannot handle the exam without cheating.
Want to see more full solutions like this?
Chapter 9 Solutions
EBK STATISTICS FOR BUSINESS & ECONOMICS


- Activ Determine compass error using amplitude (Sun). Minimum number of times that activity should be performed: 3 (1 each phase) Sample calculation (Amplitude- Sun): On 07th May 2006 at Sunset, a vessel in position 10°00'N 010°00'W observed the Sun bearing 288° by compass. Find the compass error. LMT Sunset: LIT: (+) 00d 07d 18h 00h 13m 40m UTC Sunset: 07d 18h 53m (added- since longitude is westerly) Declination (07d 18h): N 016° 55.5' d (0.7): (+) 00.6' Declination Sun: N 016° 56.1' Sin Amplitude = Sin Declination/Cos Latitude = Sin 016°56.1'/ Cos 10°00' = 0.295780189 Amplitude=W17.2N (The prefix of amplitude is named easterly if body is rising, and westerly if body is setting. The suffix is named same as declination) True Bearing=287.2° Compass Bearing= 288.0° Compass Error = 0.8° Westarrow_forwardOnly sure experts solve it correct complete solutions okkarrow_forward13. In 2000, two organizations conducted surveys to ascertain the public's opinion on banning gay men from serving in leadership roles in the Boy Scouts.• A Pew poll asked respondents whether they agreed with "the recent decision by the Supreme Court" that "the Boy Scouts of America have a constitutional right to block gay men from becoming troop leaders."A Los Angeles Times poll asked respondents whether they agreed with the following statement: "A Boy Scout leader should be removed from his duties as a troop leader if he is found out to be gay, even if he is considered by the Scout organization to be a model Boy Scout leader."One of these polls found 36% agreement; the other found 56% agreement. Which of the following statements is true?A) The Pew poll found 36% agreement, and the Los Angeles Times poll found 56% agreement.B) The Pew poll includes a leading question, while the Los Angeles Times poll uses neutral wording.C) The Los Angeles Times Poll includes a leading question, while…arrow_forward
- Introduce yourself and describe a time when you used data in a personal or professional decision. This could be anything from analyzing sales data on the job to making an informed purchasing decision about a home or car. Describe to Susan how to take a sample of the student population that would not represent the population well. Describe to Susan how to take a sample of the student population that would represent the population well. Finally, describe the relationship of a sample to a population and classify your two samples as random, systematic, cluster, stratified, or convenience.arrow_forward1.2.17. (!) Let G,, be the graph whose vertices are the permutations of (1,..., n}, with two permutations a₁, ..., a,, and b₁, ..., b, adjacent if they differ by interchanging a pair of adjacent entries (G3 shown below). Prove that G,, is connected. 132 123 213 312 321 231arrow_forwardYou are planning an experiment to determine the effect of the brand of gasoline and the weight of a car on gas mileage measured in miles per gallon. You will use a single test car, adding weights so that its total weight is 3000, 3500, or 4000 pounds. The car will drive on a test track at each weight using each of Amoco, Marathon, and Speedway gasoline. Which is the best way to organize the study? Start with 3000 pounds and Amoco and run the car on the test track. Then do 3500 and 4000 pounds. Change to Marathon and go through the three weights in order. Then change to Speedway and do the three weights in order once more. Start with 3000 pounds and Amoco and run the car on the test track. Then change to Marathon and then to Speedway without changing the weight. Then add weights to get 3500 pounds and go through the three gasolines in the same order.Then change to 4000 pounds and do the three gasolines in order again. Choose a gasoline at random, and run the car with this gasoline at…arrow_forward
- AP1.2 A child is 40 inches tall, which places her at the 90th percentile of all children of similar age. The heights for children of this age form an approximately Normal distribution with a mean of 38 inches. Based on this information, what is the standard deviation of the heights of all children of this age? 0.20 inches (c) 0.65 inches (e) 1.56 inches 0.31 inches (d) 1.21 inchesarrow_forwardAP1.1 You look at real estate ads for houses in Sarasota, Florida. Many houses range from $200,000 to $400,000 in price. The few houses on the water, however, have prices up to $15 million. Which of the following statements best describes the distribution of home prices in Sarasota? The distribution is most likely skewed to the left, and the mean is greater than the median. The distribution is most likely skewed to the left, and the mean is less than the median. The distribution is roughly symmetric with a few high outliers, and the mean is approximately equal to the median. The distribution is most likely skewed to the right, and the mean is greater than the median. The distribution is most likely skewed to the right, and the mean is less than the median.arrow_forwardDuring busy political seasons, many opinion polls are conducted. In apresidential race, how do you think the participants in polls are generally selected?Discuss any issues regarding simple random, stratified, systematic, cluster, andconvenience sampling in these polls. What about other types of polls, besides political?arrow_forward
 Big Ideas Math A Bridge To Success Algebra 1: Stu...AlgebraISBN:9781680331141Author:HOUGHTON MIFFLIN HARCOURTPublisher:Houghton Mifflin Harcourt
 Glencoe Algebra 1, Student Edition, 9780079039897...AlgebraISBN:9780079039897Author:CarterPublisher:McGraw Hill
 Holt Mcdougal Larson Pre-algebra: Student Edition...AlgebraISBN:9780547587776Author:HOLT MCDOUGALPublisher:HOLT MCDOUGAL
 College Algebra (MindTap Course List)AlgebraISBN:9781305652231Author:R. David Gustafson, Jeff HughesPublisher:Cengage Learning