Intro Stats, Books a la Carte Edition (5th Edition)
5th Edition
ISBN: 9780134210285
Author: Richard D. De Veaux, Paul Velleman, David E. Bock
Publisher: PEARSON
expand_more
expand_more
format_list_bulleted
Concept explainers
Textbook Question
Chapter 9, Problem 24E
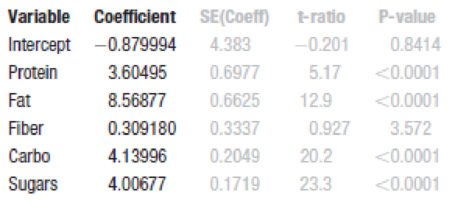
Breakfast cereals We saw in Chapter 7 that the calorie content of a breakfast cereal is linearly associated with its sugar content. Is that the whole story? Here’s the output of a regression model that regresses Calories per serving on each serving’s Protein(g), Fat(g), Fiber(g), Carbohydrate(g), and Sugars(g) content.
Dependent variable is: Calories
R-squared = 93.6% s = 5.113

- a) What is the regression equation?
- b) To check the conditions, what plots of the data might you want to examine?
- c) What does the coefficient of Fat mean in this model?
Expert Solution & Answer
Want to see the full answer?
Check out a sample textbook solution
Students have asked these similar questions
Please could you explain why 0.5 was added to each upper limpit of the intervals.Thanks
28. (a) Under what conditions do we say that two random variables X and Y are
independent?
(b) Demonstrate that if X and Y are independent, then it follows that E(XY) =
E(X)E(Y);
(e) Show by a counter example that the converse of (ii) is not necessarily true.
1. Let X and Y be random variables and suppose that A = F. Prove that
Z XI(A)+YI(A) is a random variable.
Chapter 9 Solutions
Intro Stats, Books a la Carte Edition (5th Edition)
Ch. 9.4 - Recall the regression example in Chapter 7 to...Ch. 9.4 - Prob. 2JCCh. 9.4 - Prob. 3JCCh. 9 - Housing prices The following regression model was...Ch. 9 - Candy sales A candy maker surveyed chocolate bars...Ch. 9 - Prob. 3ECh. 9 - Prob. 4ECh. 9 - Prob. 5ECh. 9 - Prob. 6ECh. 9 - Movie profits once more Look back at the...
Ch. 9 - Prob. 8ECh. 9 - Prob. 9ECh. 9 - More indicators For each of these potential...Ch. 9 - Interpretations A regression performed to predict...Ch. 9 - Prob. 12ECh. 9 - Prob. 13ECh. 9 - Scottish hill races Hill runningraces up and down...Ch. 9 - Prob. 15ECh. 9 - Candy bars per serving: calories A student...Ch. 9 - Prob. 17ECh. 9 - More hill races Here is the regression for the...Ch. 9 - Prob. 19ECh. 9 - Home prices II Here are some diagnostic plots for...Ch. 9 - Admin performance The AFL-CIO has undertaken a...Ch. 9 - GPA and SATs A large section of Stat 101 was asked...Ch. 9 - Prob. 23ECh. 9 - Breakfast cereals We saw in Chapter 7 that the...Ch. 9 - Breakfast cereals again We saw a model in Exercise...Ch. 9 - Prob. 26ECh. 9 - Hand dexterity Researchers studied the dexterity...Ch. 9 - Candy bars with nuts The data on candy bars per...Ch. 9 - Scottish hill races, men and women The Scottish...Ch. 9 - Scottish hill races, men and women climbing The...
Knowledge Booster
Learn more about
Need a deep-dive on the concept behind this application? Look no further. Learn more about this topic, statistics and related others by exploring similar questions and additional content below.Similar questions
- (c) Utilize Fubini's Theorem to demonstrate that E(X)= = (1- F(x))dx.arrow_forward(c) Describe the positive and negative parts of a random variable. How is the integral defined for a general random variable using these components?arrow_forward26. (a) Provide an example where X, X but E(X,) does not converge to E(X).arrow_forward
- (b) Demonstrate that if X and Y are independent, then it follows that E(XY) E(X)E(Y);arrow_forward(d) Under what conditions do we say that a random variable X is integrable, specifically when (i) X is a non-negative random variable and (ii) when X is a general random variable?arrow_forward29. State the Borel-Cantelli Lemmas without proof. What is the primary distinction between Lemma 1 and Lemma 2?arrow_forward
arrow_back_ios
SEE MORE QUESTIONS
arrow_forward_ios
Recommended textbooks for you
 Glencoe Algebra 1, Student Edition, 9780079039897...AlgebraISBN:9780079039897Author:CarterPublisher:McGraw Hill
 Big Ideas Math A Bridge To Success Algebra 1: Stu...AlgebraISBN:9781680331141Author:HOUGHTON MIFFLIN HARCOURTPublisher:Houghton Mifflin Harcourt
 Algebra and Trigonometry (MindTap Course List)AlgebraISBN:9781305071742Author:James Stewart, Lothar Redlin, Saleem WatsonPublisher:Cengage Learning
 Functions and Change: A Modeling Approach to Coll...AlgebraISBN:9781337111348Author:Bruce Crauder, Benny Evans, Alan NoellPublisher:Cengage Learning
 Algebra & Trigonometry with Analytic GeometryAlgebraISBN:9781133382119Author:SwokowskiPublisher:Cengage

Glencoe Algebra 1, Student Edition, 9780079039897...
Algebra
ISBN:9780079039897
Author:Carter
Publisher:McGraw Hill

Big Ideas Math A Bridge To Success Algebra 1: Stu...
Algebra
ISBN:9781680331141
Author:HOUGHTON MIFFLIN HARCOURT
Publisher:Houghton Mifflin Harcourt

Algebra and Trigonometry (MindTap Course List)
Algebra
ISBN:9781305071742
Author:James Stewart, Lothar Redlin, Saleem Watson
Publisher:Cengage Learning

Functions and Change: A Modeling Approach to Coll...
Algebra
ISBN:9781337111348
Author:Bruce Crauder, Benny Evans, Alan Noell
Publisher:Cengage Learning


Algebra & Trigonometry with Analytic Geometry
Algebra
ISBN:9781133382119
Author:Swokowski
Publisher:Cengage
Correlation Vs Regression: Difference Between them with definition & Comparison Chart; Author: Key Differences;https://www.youtube.com/watch?v=Ou2QGSJVd0U;License: Standard YouTube License, CC-BY
Correlation and Regression: Concepts with Illustrative examples; Author: LEARN & APPLY : Lean and Six Sigma;https://www.youtube.com/watch?v=xTpHD5WLuoA;License: Standard YouTube License, CC-BY