Concept explainers
Requirement 1 To Determine:
To calculate the four month moving average of the stock and S&P 500 over time and to plot the moving average against the actual stock price level. To find the instances where the price series and moving average cross and to determine if stock is likely to increase or not when the price crosses the moving average. To determine the reliability of the investment rule based on moving averages. To perform the analysis on stock price as well as S&P 500.
Introduction:
For a stock price, the moving average is the average stock price over a certain given time interval. This interval however gets updated with time. In case of a 50 day moving average, the average price is traded over the prior 50 days.
Answer to Problem 1WM
Yes there are places where the month moving average crosses the stock price line.
Explanation of Solution
Given Information:
The data is available in the given website for ANF and S&P Index.
The data was downloaded from the given website.
The four month moving average was calculated. This is done as Sum of month1, month2, month3 and month4 and the total divided by 4.
The points where the four month moving average crosses the line of the stock price was identified.
As we can see from the graph, when the moving average line crosses the stock price line, there are chances of movement of price.
The price of the stock goes down in the case when price line crosses the moving average line from above, while when it crosses from below and moves upwards, the stock prices have increased. This shows that direction of price line crossing is important.
From the graphs, it is clear that every time, the price movement has been correctly given by the four month moving average rule. Hence we can say that this investment rule is reliable.
The graphs are given as below.

Requirement 2 To Determine:
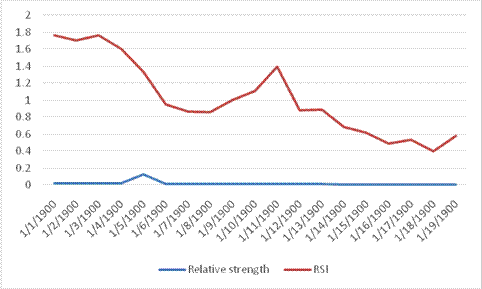
To give the relative strength of the stock compared to S&P 500. To identify the instances where there is more than 10% point increase in relative strength of stock along with instances where there is more than 10% point decrease. To determine if the in the following months, the stock can outperform or underperform S&P when relative strength increased or decreased respectively. To determine the reliability of investment rule based on relative strength.
Introduction:
Relative strength helps to measure the extent to which a security has underperformed or it has outperformed its own industry or the entire market. Relative strength is a ratio of price of security to industry price index.
Answer to Problem 1WM
Stock prices are likely to outperform the S&P. This is a reliable strategy.
Explanation of Solution
Given Information:
The data is available in the given website for the stock price and S&P.
To obtain relative strength, the price of one stock is divided by another stock price. Here ANF, S&P500 are the two stocks under consideration.

RSI is obtained as 100 − (100/(1+RS)).
The points where RSI percentage is greater than 10% is evident from the graph.
The RSI value change in percentage is given by the price change line.
The stock price could outperform S&P.
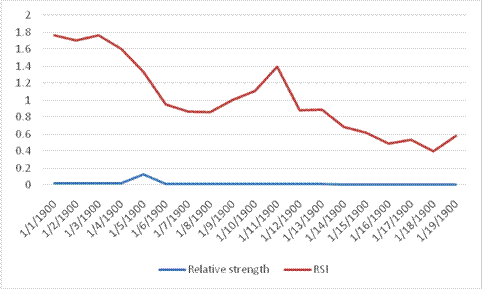
As is clear from the graph, this strategy is reliable. The relative strength of the stock can be obtained and when it shows upswing, one can enter and when the relative strength is weak, one can exit.
| Date | Relative strength | Price change | RSI |
| 11/1/2013 | 0.01629 | 0.0564857 | 1.61 |
| 12/1/2013 | 0.01538 | -0.114718 | 1.51 |
| 1/1/2014 | 0.01741 | -0.07382 | 1.68 |
| 2/1/2014 | 0.01841 | 0.0352 | 1.8074 |
| 3/1/2014 | 0.01776 | 0.04622 | 1.7449 |
| 4/1/2014 | 0.01694 | -0.0127069 | 1.666 |
| 5/1/2014 | 0.01715 | -0.11658 | 1.687 |
| 6/1/2014 | 0.01915 | 0.07166 | 1.88 |
| 7/1/2014 | 0.01778 | -0.02398 | 1.75 |
| 8/1/2014 | 0.0182 | 0.11291 | 1.79 |
| 9/1/2014 | 0.01615 | 0.09959 | 1.59 |
| 10/1/2014 | 0.01454 | 0.1589 | 1.44 |
| 11/1/2014 | 0.1224 | -0.003743 | 1.21 |
| 12/1/2014 | 0.1227 | 0.08039 | 1.21 |
| 1/1/2015 | 0.01129 | 0.081009 | 1.11 |
| 2/1/2015 | 0.01037 | 0.08575 | 1.03 |
| 3/1/2015 | 0.0095 | -0.011365 | 0.94 |
| 4/1/2015 | 0.0095 | 0.09887 | 0.95 |
| 5/1/2015 | 0.00865 | -0.08307 | 0.86 |
| 6/1/2015 | 0.0094 | 0.08409 | 0.93 |
| 7/1/2015 | 0.0087 | -0.00145 | 0.85 |
| 8/1/2015 | 0.0086 | -0.16643 | 0.85 |
| 9/1/2015 | 0.01002 | 0.0766 | 0.99 |
| 10/1/2015 | 0.0093 | -0.2061 | 0.92 |
| 11/1/2015 | 0.0112 | -0.083 | 1.1 |
| 12/1/2015 | 0.0121 | -0.024 | 1.19 |
| 1/1/2016 | 0.0124 | -0.112 | 1.22 |
| 2/1/2016 | 0.138 | -0.0186 | 1.36 |
| 3/1/2016 | 0.0141 | 0.149 | 1.38 |
| 4/1/2016 | 0.0119 | 0.267 | 1.78 |
| 5/1/2016 | 0.0088 | 0.105 | 0.87 |
| 6/1/2016 | 0.0078 | -0.134 | 0.78 |
| 7/1/2016 | 0.0089 | 0.142 | 0.88 |
| 8/1/2016 | 0.0076 | 0.093 | 0.75 |
| 9/1/2016 | 0.0069 | 0.063 | 0.68 |
| 10/1/2016 | 0.0065 | 0.049 | 0.64 |
| 11/1/2016 | 0.0061 | 0.169 | 0.61 |
| 12/1/2016 | 0.0051 | 0.049 | 0.51 |
| 1/1/2017 | 0.0049 | 0.068 | 0.48 |
| 2/1/2017 | 0.0048 | 0.002 | 0.48 |
| 3/1/2017 | 0.0048 | -0.013 | 0.48 |
| 4/1/2017 | 0.0049 | -0.088 | 0.49 |
| 5/1/2017 | 0.0053 | 0.047 | 0.53 |
| 6/1/2017 | 0.0051 | 0.224 | 0.5 |
| 7/1/2017 | 0.0039 | -0.294 | 0.39 |
| 8/1/2017 | 0.0051 | -0.129 | 0.51 |
| 9/1/2017 | 0.0057 | 0.068 | 0.57 |
Want to see more full solutions like this?
Chapter 9 Solutions
ESSENTIALS OF INVESTMENTS>LL<+CONNECT
- Bobby Nelson, made deposits of $880 at the end of each year for 6 years. Interest is 6% compounded annually. What is the value of Bobby’s annuity at the end of 6 years?arrow_forward1. Find the future value if $1,250 is invested in Simple interest account paying 6.5%: a. for 5 years b. for 20 years 2. Find the future amount $ 35,000 is invested for 30 years at 4.25% compounded: a. annually b. Quarterly c. monthly d. weekly 3. How much should be put into an account today that pays 7.75% compounded monthly if you need $10,000 in 5 years. 4. Find the effective rate for: a. 5.75% compounded quarterly b. 6.25% compounded daily. 5. $50 is invested at the end of each month into an account paying 7.5% compounded monthly. How much will be in the account after 5 years?…arrow_forwardSolve step by step no aiarrow_forward
 Essentials Of InvestmentsFinanceISBN:9781260013924Author:Bodie, Zvi, Kane, Alex, MARCUS, Alan J.Publisher:Mcgraw-hill Education,

 Foundations Of FinanceFinanceISBN:9780134897264Author:KEOWN, Arthur J., Martin, John D., PETTY, J. WilliamPublisher:Pearson,
 Fundamentals of Financial Management (MindTap Cou...FinanceISBN:9781337395250Author:Eugene F. Brigham, Joel F. HoustonPublisher:Cengage Learning
 Corporate Finance (The Mcgraw-hill/Irwin Series i...FinanceISBN:9780077861759Author:Stephen A. Ross Franco Modigliani Professor of Financial Economics Professor, Randolph W Westerfield Robert R. Dockson Deans Chair in Bus. Admin., Jeffrey Jaffe, Bradford D Jordan ProfessorPublisher:McGraw-Hill Education


