(VAR.P and STDEV.P) Choose two well-known stocks and download the latest 61 months of adjusted prices from finance.yahoo.com. Calculate the monthly returns for each stock. Now find the variance and standard deviation of the returns for each stock by using VAR.P and STDEV.P. Annualize the variance by multiplying by 12 and the standard deviation by multiplying by the square root of 12.
To determine: The variance and standard deviation of two stocks.
Answer to Problem 1SQ
Company AL’s variance is 0.0008497 and standard deviation is 2.91%. Company NX’s variance is 0.0014812 and standard deviation is 3.85%.
Explanation of Solution
Determine the variance and standard deviation of Company AL
Excel Spreadsheet:
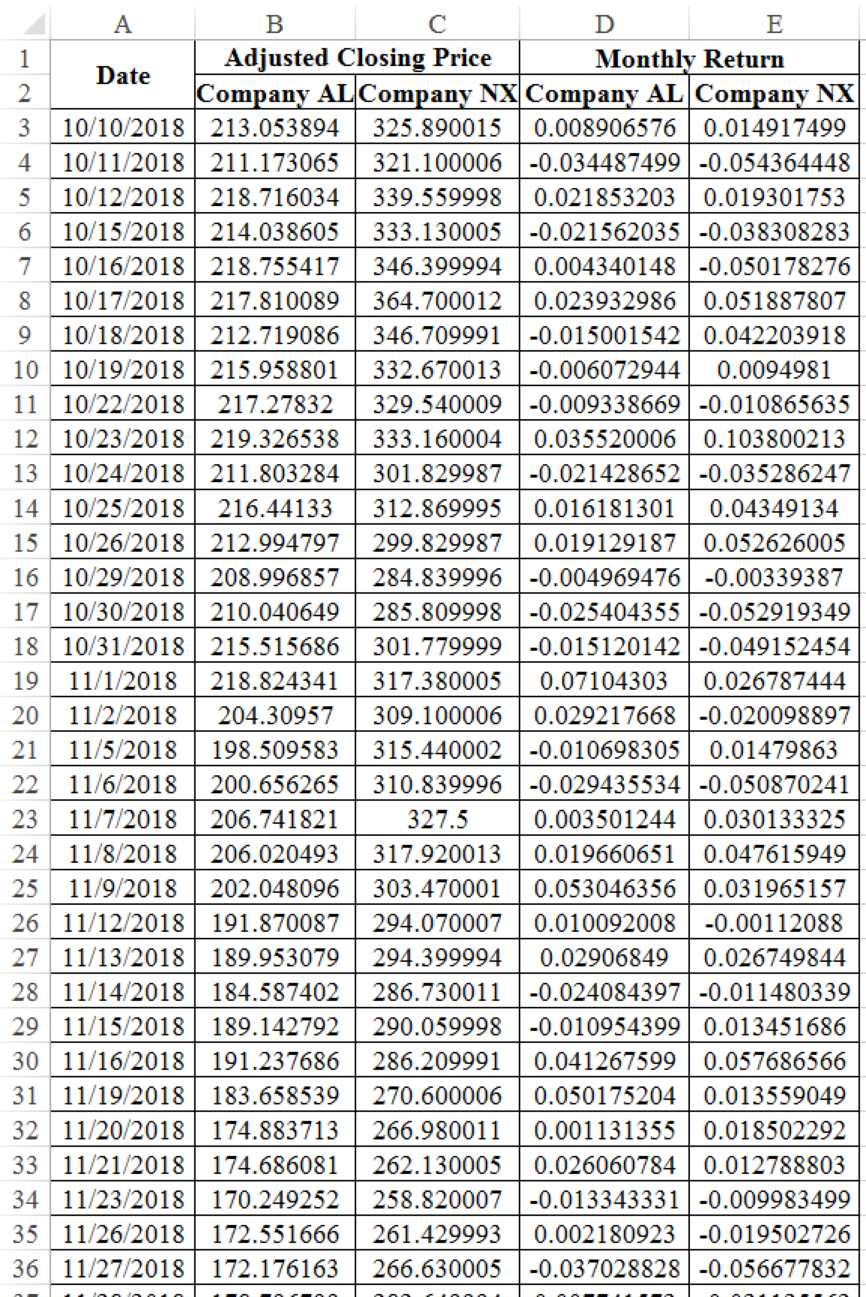
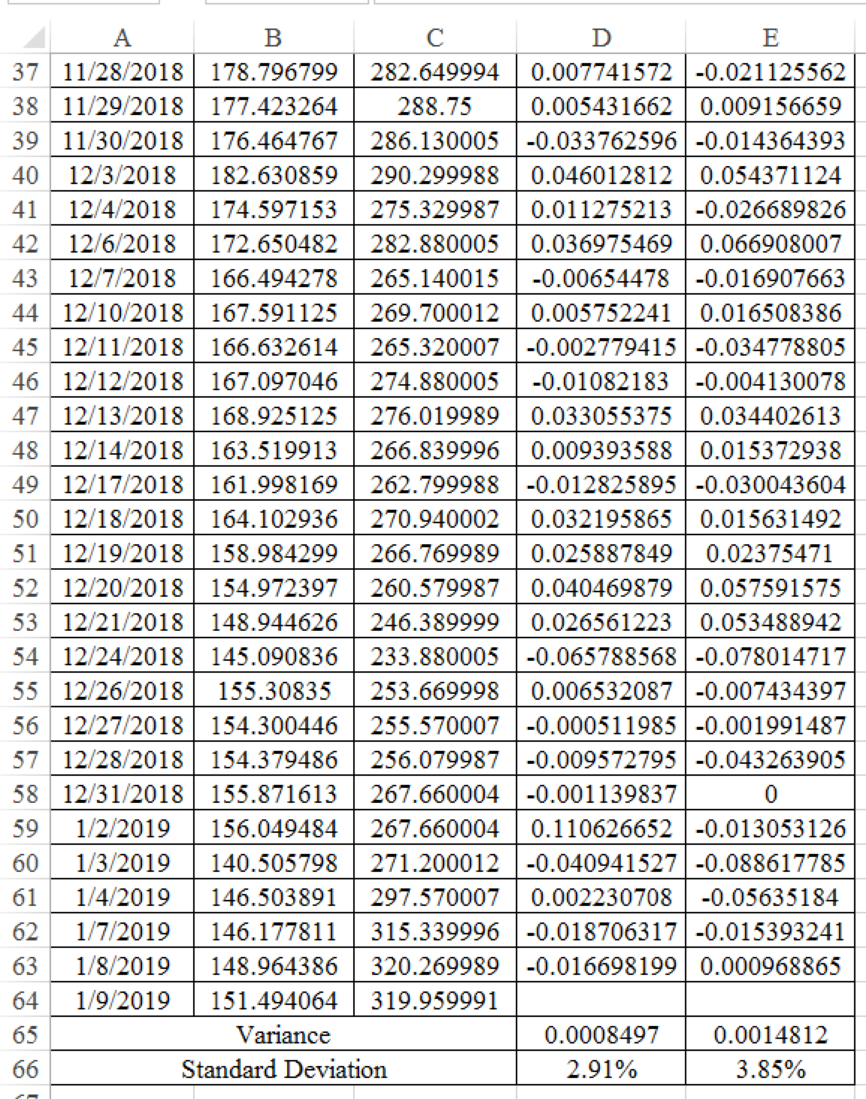
Excel Workings:
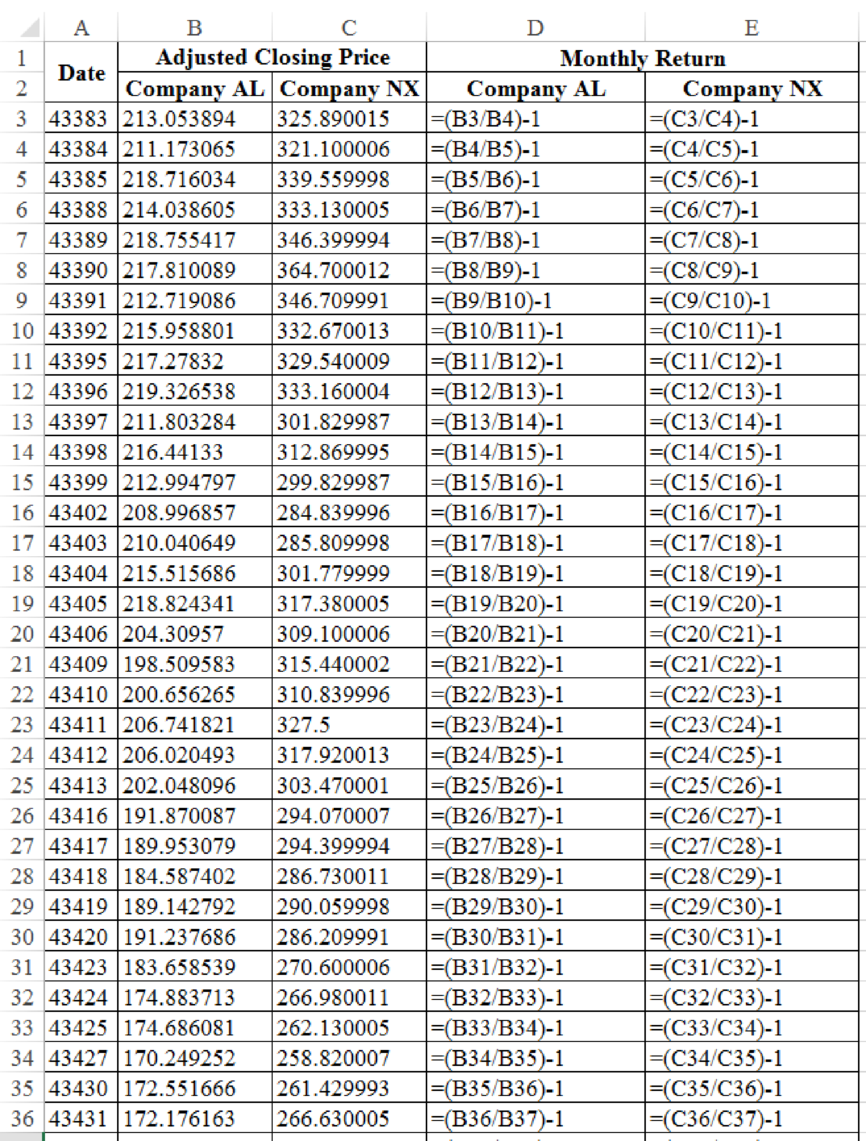
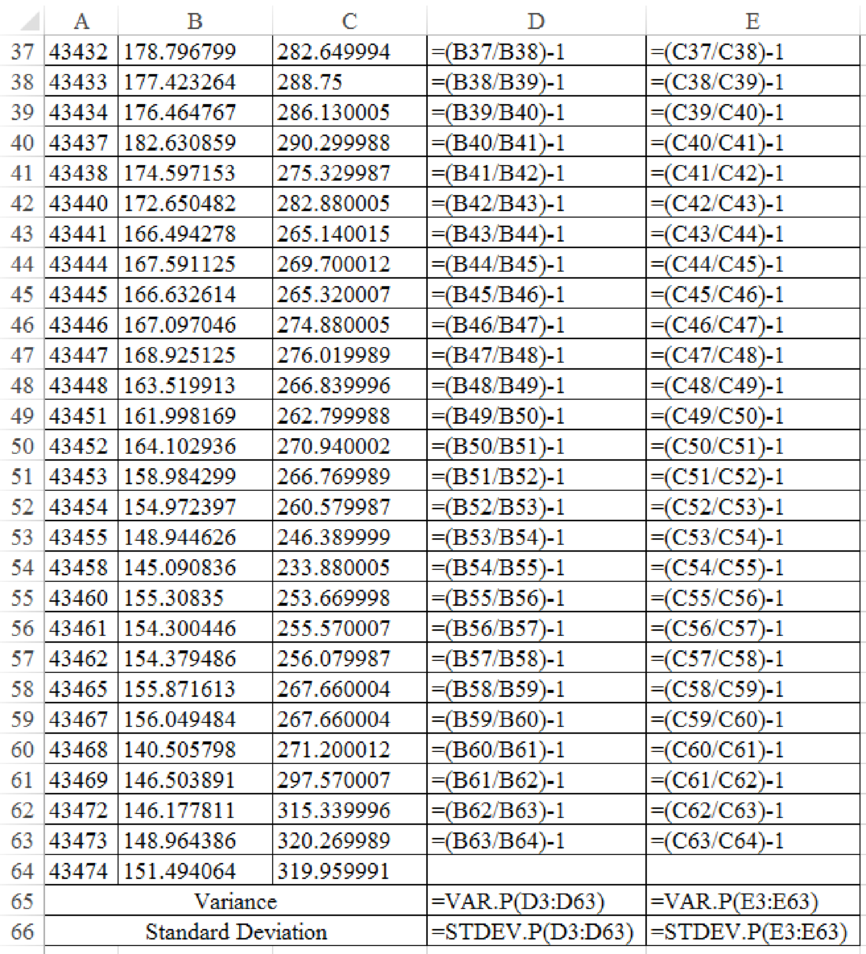
Therefore the Company AL’s variance is 0.0008497 and standard deviation is 2.91%. Company NX’s variance is 0.0014812 and standard deviation is 3.85%.
Want to see more full solutions like this?
Chapter 9 Solutions
Principles of Corporate Finance (Mcgraw-hill/Irwin Series in Finance, Insurance, and Real Estate)
Additional Business Textbook Solutions
Marketing: An Introduction (13th Edition)
Intermediate Accounting (2nd Edition)
Principles of Operations Management: Sustainability and Supply Chain Management (10th Edition)
Horngren's Accounting (12th Edition)
Gitman: Principl Manageri Finance_15 (15th Edition) (What's New in Finance)
Essentials of MIS (13th Edition)
- Professor Brown has just retired after 25 years with Jessup University. Her total pension funds have an accumulated value of $504,000, and her life expectancy is 25 more years. Her pension fund manager assumes he can earn a 9 percent return on her assets. What will be her yearly annuity for the next 25 years?arrow_forwardCaroline Moore has a contract in which she will receive the following payments for the next four years: $10,000, $11,000, $9,000, and $8,000. She will then receive an annuity of $13,000 a year from the end of the 4th through the end of the 10th year. The appropriate discount rate is 11 percent. What is the percent value of all future payments?arrow_forwardNick Weber wants to have $120,000 at the end of 10 years, and his only investment outlet is an 8 percent long-term certicate of deposit (compounded annually). With the certificate of deposit, he made an initial investment at the beginning of the year year. How much does Nick need to deposit to get the $120,000 at the end of 10 years. a. What amount could Nick pay at the end of each year annually for 10 years to achieve this same objective?arrow_forward
- High Hand Nursery has total assests of $900,000, current liabilities of $202,000, and long-term liabilities of $104,000. There is $90,000 in preferred stock outstanding. Twenty thousand shares of common stock have been issued. a. Compute book value (net worth) per share. b. If there is $40,000 in earnings available to common stockholders for dividends, and the firm's stock has a P/E of 22 times earnings per share, what is the current price of the stock? c. What is the ratio of market value per share to book value per share?arrow_forwardNeed the WACC % WACC and Optimal Capital Structure F. Pierce Products Inc. is considering changing its capital structure. F. Pierce currently has no debt and no preferred stock, but it would like to add some debt to take advantage of the tax shield. Its investment banker has indicated that the pre-tax cost of debt under various possible capital structures would be as follows: Market Debt-to-Value Ratio (wd) Market Equity-to-Value Ratio (ws) Market Debt-toEquity Ratio (D/S) Before-Tax Cost ofDebt (rd) 0.0 1.0 0.00 6.0 % 0.10 0.90 0.1111 6.4 0.20 0.80 0.2500 7.0 0.30 0.70 0.4286 8.2 0.40 0.60 0.6667 10.0 F. Pierce uses the CAPM to estimate its cost of common equity, rs, and at the time of the analaysis the risk-free rate is 5%, the market risk premium is 7%, and the company's tax rate is 25%. F. Pierce estimates that its beta now (which is "unlevered" because it currently has no debt) is 1.4. Based on this information, what…arrow_forwardNed's Co. has an average collection period of 45 days and an operating cycle of 130 days. It has a policy of keeping at least $10 on hand as a minimum cash balance, and has a beginning cash balance for the first quarter of $20. Beginning receivables for the quarter amount to $35. Sales for the first and second quarters are expected to be $110 and $125, respectively, while purchases amount to 80% of the next quarter's forecast sales. The accounts payable period is 90 days. What are the cash disbursements for the first quarter? Question 4 options: $92 $88 $76 $100 $110arrow_forward
- Liberal credit terms for customers is associated with a restrictive short-term financial policy. Question 3 options: True Falsearrow_forwardAn accounts payable period decrease would increase the length of a firm's cash cycle. Consider each in isolation. Question 6 options: True Falsearrow_forwardWhich of the following is the best definition of cash budget? Question 10 options: Costs that rise with increases in the level of investment in current assets. A forecast of cash receipts and disbursements for the next planning period. A secured short-term loan that involves either the assignment or factoring of the receivable. The time between sale of inventory and collection of the receivable. The time between receipt of inventory and payment for it.arrow_forward
- Short-term financial decisions are typically defined to include cash inflows and outflows that occur within __ year(s) or less. Question 9 options: Four Two Three Five Onearrow_forwardA national firm has sales of $575,000 and cost of goods sold of $368,000. At the beginning of the year, the inventory was $42,000. At the end of the year, the inventory balance was $45,000. What is the inventory turnover rate? Question 8 options: 8.46 times 13.22 times 43.14 times 12.78 times 28.56 timesarrow_forwardThe formula (Cash cycle + accounts payable period) correctly defines the operating cycle. Question 7 options: False Truearrow_forward
