Concept explainers
(a)
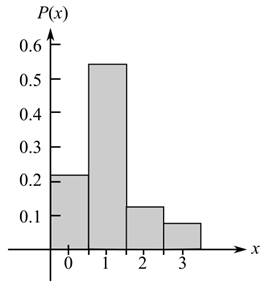
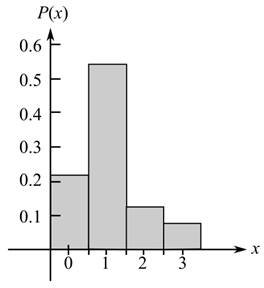
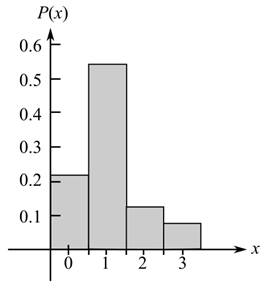
To graph: The histogram of the given probability distribution.
(a)
Answer to Problem 1RE
Solution:
The histogram is obtained as:

Explanation of Solution
Given:
The data points for
x |
0 |
1 |
2 |
3 |
P(x) |
0.22 |
0.54 |
0.16 |
0.08 |
Calculation:
Plot the given data to sketch the histogram.
The terms
The histogram is obtained as:

Conclusion:
The histogram is obtained as:

(b)
To calculate: The expected value of the probability distribution.
(b)
Answer to Problem 1RE
Solution:
The expected value of the probability distribution is 1.10.
Explanation of Solution
Given:
The data points for
x |
0 |
1 |
2 |
3 |
P(x) |
0.22 |
0.54 |
0.16 |
0.08 |
Formula used:
Here,
Calculation:
The random variable x is multiplied with its probability to obtain the product.
In the same way, for all values of x, the products obtained are summed together to obtain the expected value. It is defined as a balance point of the probability distribution.
Thus, the expected value is given as:
Want to see more full solutions like this?
Chapter 9 Solutions
MyLab Math with Pearson eText -- Standalone Access Card -- for Mathematics with Applications in the Management, Natural, and Social Sciences (12th Edition)
- 1. (i) which are not. Identify which of the following subsets of R2 are open and (a) A = (1, 3) x (1,2) (b) B = (1,3) x {1,2} (c) C = AUB (ii) Provide a sketch and a brief explanation to each of your answers. [6 Marks] Give an example of a bounded set in R2 which is not open. (iii) [2 Marks] Give an example of an open set in R2 which is not bounded. [2 Marks]arrow_forwardsat Pie Joday) B rove: ABCB. Step 1 Statement D is the midpoint of AC ED FD ZEDAZFDC Reason Given 2 ADDC Select a Reason... A OBB hp B E F D Carrow_forward2. if limit. Recall that a sequence (x(n)) CR2 converges to the limit x = R² lim ||x(n)x|| = 0. 818 - (i) Prove that a convergent sequence (x(n)) has at most one [4 Marks] (ii) Give an example of a bounded sequence (x(n)) CR2 that has no limit and has accumulation points (1, 0) and (0, 1) [3 Marks] (iii) Give an example of a sequence (x(n))neN CR2 which is located on the hyperbola x2 1/x1, contains infinitely many different Total marks 10 points and converges to the limit x = (2, 1/2). [3 Marks]arrow_forward
- 3. (i) Consider a mapping F: RN Rm. Explain in your own words the relationship between the existence of all partial derivatives of F and dif- ferentiability of F at a point x = RN. (ii) [3 Marks] Calculate the gradient of the following function f: R2 → R, f(x) = ||x||3, Total marks 10 where ||x|| = √√√x² + x/2. [7 Marks]arrow_forward1. (i) (ii) which are not. What does it mean to say that a set ECR2 is closed? [1 Mark] Identify which of the following subsets of R2 are closed and (a) A = [-1, 1] × (1, 3) (b) B = [-1, 1] x {1,3} (c) C = {(1/n², 1/n2) ER2 | n EN} Provide a sketch and a brief explanation to each of your answers. [6 Marks] (iii) Give an example of a closed set which does not have interior points. [3 Marks]arrow_forwardFunction: y=xsinx Interval: [ 0 ; π ] Requirements: Draw the graphical form of the function. Show the coordinate axes (x and y). Choose the scale yourself and show it in the flowchart. Create a flowchart based on the algorithm. Write the program code in Python. Additional requirements: Each stage must be clearly shown in the flowchart. The program must plot the graph and save it in PNG format. Write the code in a modular way (functions and main section should be separate). Expected results: The graph of y=xsinx will be plotted in the interval [ 0 ; π ]. The algorithm and flowchart will be understandable and complete. When you test the code, a graph file in PNG format will be created.arrow_forward
- A company specializing in lubrication products for vintage motors produce two blended oils, Smaza and Nefkov. They make a profit of K5,000.00 per litre of Smaza and K4,000.00 per litre of Nefkov. A litre of Smaza requires 0.4 litres of heavy oil and 0.6 litres of light oil. A litre of Nefkov requires 0.8 litres of heavy oil and 0.2 litres of light oil. The company has 100 litres of heavy oil and 80 litres of light oil. How many litres of each product should they make to maximize profits and what level of profit will they obtain? Show all your workings.arrow_forwardUse the graphs to find estimates for the solutions of the simultaneous equations.arrow_forwardPLEASE SOLVE STEP BY STEP WITHOUT ARTIFICIAL INTELLIGENCE OR CHATGPT SOLVE BY HAND STEP BY STEParrow_forward
 Discrete Mathematics and Its Applications ( 8th I...MathISBN:9781259676512Author:Kenneth H RosenPublisher:McGraw-Hill Education
 Mathematics for Elementary Teachers with Activiti...MathISBN:9780134392790Author:Beckmann, SybillaPublisher:PEARSON
 Thinking Mathematically (7th Edition)MathISBN:9780134683713Author:Robert F. BlitzerPublisher:PEARSON
 Discrete Mathematics With ApplicationsMathISBN:9781337694193Author:EPP, Susanna S.Publisher:Cengage Learning,
 Pathways To Math Literacy (looseleaf)MathISBN:9781259985607Author:David Sobecki Professor, Brian A. MercerPublisher:McGraw-Hill Education


