
Concept explainers
Videos
To calculate: The probability distribution for the random variable X, if there is a couple that has two children and X is a number of boys, assuming that the chances of a child being a boy or a girl are same.
Answer to Problem 1RE
Solution:
The probability distribution for a number of boys is:
Explanation of Solution
Given Information:
There is a couple that has two children and X is a number of boys, assuming that the chances of a child being a boy or a girl are the same.
Formula Used:
If n is the number of trials and X is the number of successes, then the probability for a particular value of X is given by:
Calculation:
Consider the number of children
Evaluate the probability of success which is the probability of a boy.
Evaluate the probability of failure which is the probability of a girl.
Possible values of X being a boy child are
Now estimate the probability of each value of n by applying the formula
Evaluate the probability
Evaluate the probability
Evaluate the probability
The probability distribution for the number of boys is,
Graph:
The steps to draw the histogram of the binomial distribution is
Step 1: Place x values on the horizontal axis.
Step2. Place the value of probability
Step3. Construct a bar over each value of x extending from
Draw the graph of the binomial distribution as follows:
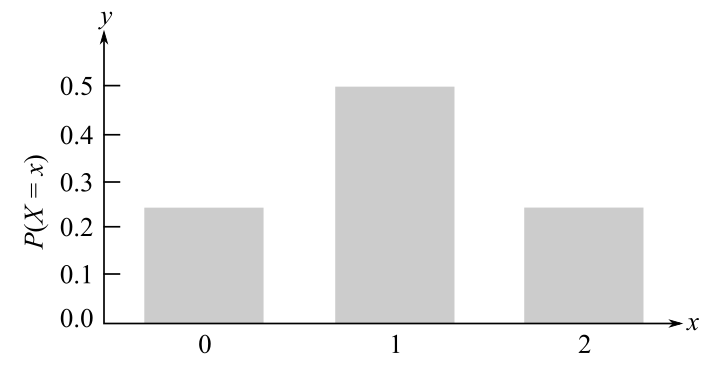
Interpretation:
The histogram of the probability distribution of a boy child out of two children where the probability of selecting a girl or boy child is equal.
Want to see more full solutions like this?
Chapter 9 Solutions
Finite Mathematics and Applied Calculus (MindTap Course List)


- Find the volume of the region under the surface z = xy² and above the area bounded by x = y² and x-2y= 8. Round your answer to four decimal places.arrow_forwardУ Suppose that f(x, y) = · at which {(x, y) | 0≤ x ≤ 2,-x≤ y ≤√x}. 1+x D Q Then the double integral of f(x, y) over D is || | f(x, y)dxdy = | Round your answer to four decimal places.arrow_forwardD The region D above can be describe in two ways. 1. If we visualize the region having "top" and "bottom" boundaries, express each as functions of and provide the interval of x-values that covers the entire region. "top" boundary 92(x) = | "bottom" boundary 91(x) = interval of values that covers the region = 2. If we visualize the region having "right" and "left" boundaries, express each as functions of y and provide the interval of y-values that covers the entire region. "right" boundary f2(y) = | "left" boundary fi(y) =| interval of y values that covers the region =arrow_forward
- Find the volume of the region under the surface z = corners (0,0,0), (2,0,0) and (0,5, 0). Round your answer to one decimal place. 5x5 and above the triangle in the xy-plane witharrow_forwardGiven y = 4x and y = x² +3, describe the region for Type I and Type II. Type I 8. y + 2 -24 -1 1 2 2.5 X Type II N 1.5- x 1- 0.5 -0.5 -1 1 m y -2> 3 10arrow_forwardGiven D = {(x, y) | O≤x≤2, ½ ≤y≤1 } and f(x, y) = xy then evaluate f(x, y)d using the Type II technique. 1.2 1.0 0.8 y 0.6 0.4 0.2 0- -0.2 0 0.5 1 1.5 2 X X This plot is an example of the function over region D. The region identified in your problem will be slightly different. y upper integration limit Integral Valuearrow_forward
- This way the ratio test was done in this conflicts what I learned which makes it difficult for me to follow. I was taught with the limit as n approaches infinity for (an+1)/(an) = L I need to find the interval of convergence for the series tan-1(x2). (The question has a table of Maclaurin series which I followed as well) https://www.bartleby.com/solution-answer/chapter-92-problem-7e-advanced-placement-calculus-graphical-numerical-algebraic-sixth-edition-high-school-binding-copyright-2020-6th-edition/9781418300203/2c1feea0-c562-4cd3-82af-bef147eadaf9arrow_forwardSuppose that f(x, y) = y√√r³ +1 on the domain D = {(x, y) | 0 ≤y≤x≤ 1}. D Then the double integral of f(x, y) over D is [ ], f(x, y)dzdy =[ Round your answer to four decimal places.arrow_forwardConsider the function f(x) = 2x² - 8x + 3 over the interval 0 ≤ x ≤ 9. Complete the following steps to find the global (absolute) extrema on the interval. Answer exactly. Separate multiple answers with a comma. a. Find the derivative of f (x) = 2x² - 8x+3 f'(x) b. Find any critical point(s) c within the intervl 0 < x < 9. (Enter as reduced fraction as needed) c. Evaluate the function at the critical point(s). (Enter as reduced fraction as needed. Enter DNE if none of the critical points are inside the interval) f(c) d. Evaluate the function at the endpoints of the interval 0 ≤ x ≤ 9. f(0) f(9) e. Based on the above results, find the global extrema on the interval and where they occur. The global maximum value is at a The global minimum value is at xarrow_forward
- Determine the values and locations of the global (absolute) and local extrema on the graph given. Assume the domain is a closed interval and the graph represents the entirety of the function. 3 y -6-5-4-3 2 1 -1 -2 -3 Separate multiple answers with a comma. Global maximum: y Global minimum: y Local maxima: y Local minima: y x 6 at a at a at x= at x=arrow_forwardA ball is thrown into the air and its height (in meters) is given by h (t) in seconds. -4.92 + 30t+1, where t is a. After how long does the ball reach its maximum height? Round to 2 decimal places. seconds b. What is the maximum height of the ball? Round to 2 decimal places. metersarrow_forwardDetermine where the absolute and local extrema occur on the graph given. Assume the domain is a closed interval and the graph represents the entirety of the function. 1.5 y 1 0.5 -3 -2 -0.5 -1 -1.5 Separate multiple answers with a comma. Absolute maximum at Absolute minimum at Local maxima at Local minima at a x 2 3 аarrow_forward
 Holt Mcdougal Larson Pre-algebra: Student Edition...AlgebraISBN:9780547587776Author:HOLT MCDOUGALPublisher:HOLT MCDOUGAL