
Elementary Statistics ( 3rd International Edition ) Isbn:9781260092561
3rd Edition
ISBN: 9781259969454
Author: William Navidi Prof.; Barry Monk Professor
Publisher: McGraw-Hill Education
expand_more
expand_more
format_list_bulleted
Concept explainers
Videos
Question
Chapter 9, Problem 1CS
To determine
To find: The conclusion from the given data.
Expert Solution & Answer
Answer to Problem 1CS
The conclusion from the given data is the high record occurred more recently than the low record which means
Explanation of Solution
Given information:
The probability is
| Date | High | Year | Low | Year | More Recent |
| Jan 1 | 69 | 2005 | -14 | 1881 | High |
| 8 | 73 | 2008 | 0 | 1878 | High |
| 15 | 77 | 1932 | 4 | 1886 | High |
| 22 | 76 | 1927 | I | 1893 | High |
| 29 | 76 | 1975 | 2 | 1873 | High |
| Feb 5 | 70 | 1 99l* | -2 | 1918* | High |
| 12 | 74 | 1999 | 4 | 1899 | High |
| 19 | 74 | 1939 | 4 | 1903 | High |
| 26 | 74 | 1 932 | 12 | 1970 | Low |
| Mar 5 | 83 | 1976 | 6 | 1872 | High |
| 12 | 89 | 1990 | 11 | 1900 | High |
| 19 | 87 | 1645 | 12 | 1876 | High |
| 26 | 87 | 1921 | 23 | 1955 | Low |
| Apr 2 | 89 | 1963 | 23 | 1907 | High |
| 9 | 90 | 1 959 | 28 | 1972* | Low |
| 16 | 92 | 2002 | 29 | 1928 | High |
| 23 | 95 | 1960 | 33 | 1933* | High |
| 30 | 92 | 1642 | 34 | 1874 | High |
| May7 | 95 | 1930 | 38 | 1970 | Low |
| 14 | 93 | 1956 | 41 | 1928 | High |
| 21 | 95 | 1934 | 41 | 1907 | High |
| 28 | 97 | 1941 | 42 | 1961 | Low |
| Jun 4 | 99 | 1925 | 46 | 1929* | Low |
| 11 | 101 | 1 91 1 | 45 | 1913 | Low |
| 18 | 97 | 1944 | 51 | 1965. | Low |
| 25 | 100 | 1997 | 53 | 1902 | High |
| Ju l 2 | I OI | 1 898 | 55 | 1 940 | Low |
| 9 | 104 | 1936 | 55 | 1891 | High |
| 16 | 104 | 1988 | 56 | 1930* | High |
| 23 | 102 | 201 1 | 56 | 1 890 | High |
| 30 | 99 | 1953 | 56 | 1914 | High |
| Aug 6 | 106 | 1918 | 53 | 1912 | High |
| 13 | 101 | 1 881 | 55 | 1 930* | Low |
| 20 | 101 | 1983 | 50 | 1896 | High |
| 27 | 100 | 1987 | 51 | 1885 | High |
| Sep 3 | 98 | 1953 | 48 | 1909* | High |
| 10 | 98 | 1983 | 44 | 1883 | High |
| 17 | 96 | 1991 | 44 | 1923 | High |
| 24 | 99 | 2010 | 39 | 1963 | High |
| Oct 1 | 93 | 1941* | 36 | 1899 | High |
| 8 | 91 | 2007 | 36 | 1964* | High |
| 15 | 87 | 1975 | 32 | 1874 | High |
| 22 | 84 | 1979* | 29 | 1895 | High |
| 29 | 82 | 191& | 30 | 1976* | Low |
| Nov 5 | 81 | 2003* | 20 | 1879 | High |
| 12 | 77 | 1912* | 24 | 1926 | Low |
| 19 | 77 | 1928 | 18 | 1891 | High |
| 26 | 74 | 1979 | 17 | 1950 | High |
| Dec 3 | 71 | 2012 | 15 | 1976 | High |
| 10 | 67 | 1966* | 4 | 1876 | High |
| 17 | 64 | 1984* | 10 | 1876 | High |
| 24 | 69 | 1933 | 5 | 1983 | Low |
Concept used:
MINITAB is used.
Calculation:
The MINITAB output is shown below.
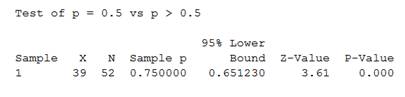
Figure-1
From Figure-1, the
From significance level,
Since, the
Thus, null hypothesis is rejected.
Therefore, the conclusion from the given data is the high record occurred more recently than the low record which means
Want to see more full solutions like this?
Subscribe now to access step-by-step solutions to millions of textbook problems written by subject matter experts!
Students have asked these similar questions
Question 2: When John started his first job, his first end-of-year salary was $82,500. In the following years, he received salary raises as shown in the following table.
Fill the Table: Fill the following table showing his end-of-year salary for each year. I have already provided the end-of-year salaries for the first three years. Calculate the end-of-year salaries for the remaining years using Excel. (If you Excel answer for the top 3 cells is not the same as the one in the following table, your formula / approach is incorrect) (2 points)
Geometric Mean of Salary Raises: Calculate the geometric mean of the salary raises using the percentage figures provided in the second column named “% Raise”. (The geometric mean for this calculation should be nearly identical to the arithmetic mean. If your answer deviates significantly from the mean, it's likely incorrect. 2 points)
Hint for the first part of question 2: To assist you with filling out the table in the first part of the question,…
Consider a sample with data values of 27, 25, 20, 15, 30, 34, 28, and 25. Compute the range, interquartile range, variance, and standard deviation (to a maximum of 2 decimals, if decimals are necessary).
Range
Interquartile range
Variance
Standard deviation
Perform a Step by step following tests in Microsoft Excel. Each of the following is 0.5 points, with a total of 6 points. Provide your answers in the following table.
Median
Standard Deviation
Minimum
Maximum
Range
1st Quartile
2nd Quartile
3rd Quartile
Skewness; provide a one sentence explanation of what does the skewness value indicates
Kurtosis; provide a one sentence explanation of what does the kurtosis value indicates
Make a labelled histogram; no point awarded if it is not labelled
Make a labelled boxplot; no point awarded if it is not labelled
Data
27
30
22
25
24
22
20
28
20
26
21
23
24
20
28
30
20
28
29
30
21
26
29
25
26
25
20
30
26
28
25
21
22
27
27
24
26
22
29
28
30
22
22
22
30
21
21
30
26
20
Chapter 9 Solutions
Elementary Statistics ( 3rd International Edition ) Isbn:9781260092561
Ch. 9.1 - In Exercises 7 and 8, fill in each blank with the...Ch. 9.1 - In Exercises 7 and 8, fill in each blank with the...Ch. 9.1 - In Exercises 9-12, determine whether the statement...Ch. 9.1 - In Exercises 9-12, determine whether the statement...Ch. 9.1 - In Exercises 9-12, determine whether the statement...Ch. 9.1 - In Exercises 9-12, determine whether the statement...Ch. 9.1 - In Exercises 13-16, determine whether the...Ch. 9.1 - In Exercises 13-16, determine whether the...Ch. 9.1 - In Exercises 13-16, determine whether the...Ch. 9.1 - In Exercises 13-16, determine whether the...
Ch. 9.1 - In Exercises 17–20, determine whether the...Ch. 9.1 - In Exercises 17-20, determine whether the outcome...Ch. 9.1 - In Exercises 17–20, determine whether the...Ch. 9.1 - In Exercises 17–20, determine whether the...Ch. 9.1 - Fertilizer: A new type of fertilizer is being...Ch. 9.1 - Big fish: A sample of loo flounder of a certain...Ch. 9.1 - Check, please: A restaurant owner claims that the...Ch. 9.1 - Coffee: The mean caffeine content per cup of...Ch. 9.1 - Big dogs: A veterinarian claims that the mean...Ch. 9.1 - Business trips A sales manager believes that the...Ch. 9.1 - Type I error: A company that manufactures steel...Ch. 9.1 - Type I error: Washers used in a certain...Ch. 9.1 - Scales: It is desired to check the calibration of...Ch. 9.1 - IQ: Scores on a certain IQ test are known to have...Ch. 9.1 - Probability of error: A corn has probability p of...Ch. 9.2 - In Exercises 23–28, fill in each blank with the...Ch. 9.2 - In Exercises 23-28, fill in each blank with the...Ch. 9.2 - Prob. 25ECh. 9.2 - In Exercises 23-28, fill in each blank with the...Ch. 9.2 - Prob. 27ECh. 9.2 - Prob. 28ECh. 9.2 - In Exercises 29-34, determine whether the...Ch. 9.2 - In Exercises 29-34, determine whether the...Ch. 9.2 - Prob. 31ECh. 9.2 - Prob. 32ECh. 9.2 - Prob. 33ECh. 9.2 - Prob. 34ECh. 9.2 - A test is made of H0:=50 versus H1:50. A sample of...Ch. 9.2 - A test is made of H0:=14 versus H1:14. A sample of...Ch. 9.2 - A test is made of H0:=130 versus H1:130. A sample...Ch. 9.2 - A test is made of H0:=5 versus H1:5. A sample of...Ch. 9.2 - A test of the hypothesis H0:=65 versus H1:65 was...Ch. 9.2 - A test of the hypothesis H0:=150 versus H1:150 was...Ch. 9.2 - True or false: If P=0.02, then The result is...Ch. 9.2 - True or false: If P=0.08, then The result is...Ch. 9.2 - A test of H0:=17 versus H1:17 is performed using a...Ch. 9.2 - A test of H0:=50 versus H1:50 is performed using a...Ch. 9.2 - A test of H0:=0 versus H1:0 is performed using a...Ch. 9.2 - Prob. 46ECh. 9.2 - If H0 is rejected at the =0.05 level, which of the...Ch. 9.2 - Prob. 48ECh. 9.2 - If P=0.03, which of the following is the best...Ch. 9.2 - Prob. 50ECh. 9.2 - Netflix: A study conducted in 2015 by the...Ch. 9.2 - Are you smarter than a second grader? A random...Ch. 9.2 - Height and age: Are older men shorter than younger...Ch. 9.2 - Calibrating a scale: Making sure that the scales...Ch. 9.2 - Prob. 55ECh. 9.2 - Prob. 56ECh. 9.2 - Prob. 57ECh. 9.2 - Prob. 58ECh. 9.2 - What are you drinking? Environmental Protection...Ch. 9.2 - Prob. 60ECh. 9.2 - Interpret calculator display: The age in years was...Ch. 9.2 - Interpret calculator display: The number of...Ch. 9.2 - Prob. 63ECh. 9.2 - Prob. 64ECh. 9.2 - Prob. 65ECh. 9.2 - Statistical or practical significance: A new...Ch. 9.2 - Test scores: A math teacher has developed a new...Ch. 9.2 - Prob. 68ECh. 9.2 - Prob. 69ECh. 9.2 - Prob. 70ECh. 9.2 - Prob. 71ECh. 9.2 - Large samples and practical significance: A sample...Ch. 9.3 - In Exercises 7 and 8, fill in each blank with the...Ch. 9.3 - Prob. 8ECh. 9.3 - Prob. 9ECh. 9.3 - Prob. 10ECh. 9.3 - Find the P-value for the following values of the...Ch. 9.3 - Find the P-value for the following values of the...Ch. 9.3 - Find the critical value or values for the...Ch. 9.3 - Find the critical value or values for the...Ch. 9.3 - Is there a doctor in the house? The market...Ch. 9.3 - College tuition: The mean annual tuition and fees...Ch. 9.3 - Big babies: The National Health Statistics Reports...Ch. 9.3 - Good credit: The Fair Isaac Corporation (FICO)...Ch. 9.3 - Commuting to work: The American Community Survey...Ch. 9.3 - Watching TV: The General Social Survey asked a...Ch. 9.3 - Prob. 21ECh. 9.3 - How much is in that can? A machine that fills...Ch. 9.3 - Prob. 23ECh. 9.3 - Prob. 24ECh. 9.3 - Keep cool: Following are prices, in dollars, of a...Ch. 9.3 - Prob. 26ECh. 9.3 - Prob. 27ECh. 9.3 - Prob. 28ECh. 9.3 - Interpret calculator display: A sample of adults...Ch. 9.3 - Prob. 30ECh. 9.3 - Prob. 31ECh. 9.3 - Prob. 32ECh. 9.3 - Does this diet work? In a study of the...Ch. 9.3 - Prob. 34ECh. 9.3 - Prob. 35ECh. 9.3 - Prob. 36ECh. 9.3 - Larger or smaller P-value? In a study of sleeping...Ch. 9.3 - Larger or smaller P-value? Juan and Mary want to...Ch. 9.3 - Interpret a P-value: A real estate agent believes...Ch. 9.3 - Interpret a P-value: The manufacturer of a...Ch. 9.3 - Using z instead of t: When the sample size is...Ch. 9.4 - In Exercises 5 and 6, fill in each blank with the...Ch. 9.4 - In Exercises 5 and 6, fill in each blank with the...Ch. 9.4 - Prob. 7ECh. 9.4 - Prob. 8ECh. 9.4 - In a simple random sample of size 80, there were...Ch. 9.4 - Prob. 10ECh. 9.4 - In a simple random sample of size 75, there were...Ch. 9.4 - In a simple random sample of size 150, there were...Ch. 9.4 - Spam: According to SecureList, 71.8% of all email...Ch. 9.4 - Confidence in banks: A poll conducted by the...Ch. 9.4 - Kids with cell phones: A marketing manager for a...Ch. 9.4 - Internet tax: The Gallup Poll asked 1015 U.S....Ch. 9.4 - Quit smoking: In a survey of 444 HIV-positive...Ch. 9.4 - Game consoles: A poll taken by the Software...Ch. 9.4 - Tattoo: A Harris poll taken surveyed 2016 adults...Ch. 9.4 - Curing diabetes: Vertical banded gastroplasty is a...Ch. 9.4 - Tweet tweet: An article in Forbes magazine...Ch. 9.4 - Online photos: A Pew poll surveyed 1802 Internet...Ch. 9.4 - Choosing a doctor: Which do patients value more...Ch. 9.4 - Prob. 24ECh. 9.4 - Interpret calculator display: In a recent poll,...Ch. 9.4 - Prob. 26ECh. 9.4 - Prob. 27ECh. 9.4 - Prob. 28ECh. 9.4 - Prob. 29ECh. 9.4 - Who will you vote for? A simple random sample of...Ch. 9.4 - Prob. 31ECh. 9.4 - Dont perform a test: Over the past 100 days, the...Ch. 9.4 - Exact test: When np010 or n(1p0)10, we cannot use...Ch. 9.5 - In Exercises 5 and 6, fill in each blank with the...Ch. 9.5 - Prob. 6ECh. 9.5 - Prob. 7ECh. 9.5 - Prob. 8ECh. 9.5 - Prob. 9ECh. 9.5 - Prob. 10ECh. 9.5 - Prob. 11ECh. 9.5 - Prob. 12ECh. 9.5 - A random sample of size 25 from a normal...Ch. 9.5 - Prob. 14ECh. 9.5 - Babies: A sample of 25 one-year-old girls had a...Ch. 9.5 - Watching TV: The General Social Survey asked a...Ch. 9.5 - IQ scores: Scores on an IQ test are normally...Ch. 9.5 - SAT scores: Scores on the math SAT are normally...Ch. 9.5 - How much is in that can? A machine that fills...Ch. 9.5 - Prob. 20ECh. 9.5 - Prob. 21ECh. 9.5 - Prob. 22ECh. 9.5 - Prob. 23ECh. 9.6 - In Exercises 5–12, slate which type of parameter...Ch. 9.6 - Prob. 6ECh. 9.6 - Prob. 7ECh. 9.6 - Prob. 8ECh. 9.6 - Prob. 9ECh. 9.6 - Prob. 10ECh. 9.6 - Prob. 11ECh. 9.6 - Prob. 12ECh. 9.6 - Saving for college: In a survey of 909 U.S. adults...Ch. 9.6 - Prob. 14ECh. 9.6 - Cookies: Following are the weights of 8 boxes of...Ch. 9.6 - Prob. 16ECh. 9.6 - Teacher salaries: A random sample of 50 public...Ch. 9.6 - Prob. 18ECh. 9.6 - Mercury pollution: Mercury is a toxic metal that...Ch. 9.6 - Prob. 20ECh. 9.7 - In Exercises 3-5, fill in each blank with the...Ch. 9.7 - Prob. 4ECh. 9.7 - Prob. 5ECh. 9.7 - In Exercises 6-8, determine whether the statement...Ch. 9.7 - Prob. 7ECh. 9.7 - Prob. 8ECh. 9.7 - Prob. 9ECh. 9.7 - A test has power 0.80 when 1=3.5. True or false:...Ch. 9.7 - Prob. 11ECh. 9.7 - Prob. 12ECh. 9.7 - Prob. 13ECh. 9.7 - Watch sour cholesterol: An article in the...Ch. 9.7 - Prob. 15ECh. 9.7 - Coffee beans: Refer to Exercise 12. A test of the...Ch. 9.7 - Prob. 17ECh. 9.7 - Prob. 18ECh. 9.7 - Prob. 19ECh. 9 - Fill in the blank: A test of the hypotheses H0:=65...Ch. 9 - A hypothesis test results in a P-value of 0.008....Ch. 9 - Prob. 3CQCh. 9 - Prob. 4CQCh. 9 - Prob. 5CQCh. 9 - Prob. 6CQCh. 9 - Prob. 7CQCh. 9 - In a random sample of 500 people who took their...Ch. 9 - Prob. 9CQCh. 9 - Prob. 10CQCh. 9 - Prob. 11CQCh. 9 - In a test of H0:=5 versus H1:5, the value of the...Ch. 9 - True or false: We can perform a test for a...Ch. 9 - Prob. 14CQCh. 9 - Prob. 15CQCh. 9 - Prob. 1RECh. 9 - Prob. 2RECh. 9 - Prob. 3RECh. 9 - Prob. 4RECh. 9 - Prob. 5RECh. 9 - Prob. 6RECh. 9 - Prob. 7RECh. 9 - Job satisfaction: The General Social Survey...Ch. 9 - Prob. 9RECh. 9 - Prob. 10RECh. 9 - Prob. 11RECh. 9 - Prob. 12RECh. 9 - Prob. 13RECh. 9 - Prob. 14RECh. 9 - Prob. 15RECh. 9 - Prob. 1WAICh. 9 - Prob. 2WAICh. 9 - Prob. 3WAICh. 9 - Prob. 4WAICh. 9 - Prob. 5WAICh. 9 - Prob. 6WAICh. 9 - Prob. 1CSCh. 9 - Prob. 2CSCh. 9 - Prob. 3CSCh. 9 - Prob. 4CSCh. 9 - Prob. 5CSCh. 9 - Prob. 6CSCh. 9 - Prob. 7CS
Knowledge Booster


Learn more about
Need a deep-dive on the concept behind this application? Look no further. Learn more about this topic, statistics and related others by exploring similar questions and additional content below.Similar questions
- Obtain the linear equation for trend for time series with St² = 140, Ey = 16.91 and Σty= 62.02, m n = 7arrow_forwardA quality characteristic of a product is normally distributed with mean μ and standard deviation σ = 1. Speci- fications on the characteristic are 6≤x≤8. A unit that falls within specifications on this quality characteristic results in a profit of Co. However, if x 8, the profit is -C2. Find the value ofμ that maximizes the expected profit.arrow_forwardA) The output voltage of a power supply is normally distributed with mean 5 V and standard deviation 0.02 V. If the lower and upper specifications for voltage are 4.95 V and 5.05 V, respectively, what is the probability that a power supply selected at random conform to the specifications on voltage? B) Continuation of A. Reconsider the power supply manufacturing process in A. Suppose We wanted to improve the process. Can shifting the mean reduce the number of nonconforming units produced? How much would the process variability need to be reduced in order to have all but one out of 1000 units conform to the specifications?arrow_forward
- der to complete the Case X T Civil Service Numerical Test Sec X T Casework Skills Practice Test Maseline Vaseline x + euauthoring.panpowered.com/DeliveryWeb/Civil Service Main/84589a48-6934-4b6e-a6e1-a5d75f559df9?transferToken-News NGSSON The table below shows the best price available for various items from 4 uniform suppliers. The prices do not include VAT (charged at 20%). Item Waterproof boots A1-Uniforms (£)Best Trade (£)Clothing Tech (£)Dress Right (£) 59.99 39.99 59.99 49.99 Trousers 9.89 9.98 9.99 11.99 Shirts 14.99 15.99 16.99 12.99 Hi-Vis vest 4.49 4.50 4.00 4.00 20.00 25.00 19.50 19.99 Hard hats A company needs to buy a set of 12 uniforms which includes 1 of each item. If the special offers are included which supplier is cheapest? OOO A1-Uniforms Best Trade Clothing Tech Q Search + ** 109 8 CO* F10 Home F11 F12 6arrow_forwardto complete the Case × T Civil Service Numerical Test Sec x T Casework Skills Practice Test + Vaseline euauthoring.panpowered.com/DeliveryWeb/Civil Service Main/84589a48-b934-4b6e-a6e1-a5d75f559df9?transferToken=MxNewOS NGFSPSZSMOMzuz The table below shows the best price available for various items from 4 uniform suppliers. The prices do not include VAT (charged at 20%). Item A1-Uniforms (£)Best Trade (£)Clothing Tech (£)Dress Right (£) Waterproof boots 59.99 39.99 59.99 49.99 Trousers 9.89 9.98 9.99 11.99 Shirts 14.99 15.99 16.99 12.99 Hi-Vis vest 4.49 4.50 4.00 4.00 20.00 25.00 19.50 19.99 Hard hats A company needs to buy a set of 12 uniforms which includes 1 of each item. If the special offers are included, which supplier is cheapest? O O O O A1-Uniforms Best Trade Clothing Tech Dress Right Q Search ENG L UK +0 F6 四吧 6 78 ㄓ F10 9% * CO 1 F12 34 Oarrow_forwardCritics review films out of 5 based on three attributes: the story, the special effects and the acting. The ratings of four critics for a film are collected in the table below.CriticSpecialStory rating Effects rating Acting rating Critic 14.44.34.5Critic 24.14.23.9Critic 33.943.4Critic 44.24.14.2Critic 1 also gave the film a rating for the Director's ability. If the average of Critic 1's ratings was 4.3 what rating did they give to the Director's ability?3.94.04.14.24.3arrow_forward
- Two measurements are made of some quantity. For the first measurement, the average is 74.4528, the RMS error is 6.7441, and the uncertainty of the mean is 0.9264. For the second one, the average is 76.8415, the standard deviation is 8.3348, and the uncertainty of the mean is 1.1448. The expected value is exactly 75. 13. Express the first measurement in public notation. 14. Is there a significant difference between the two measurements? 1 15. How does the first measurement compare with the expected value? 16. How does the second measurement compare with the expected value?arrow_forwardA hat contains slips of paper numbered 1 through 6. You draw two slips of paper at random from the hat,without replacing the first slip into the hat.(a) (5 points) Write out the sample space S for this experiment.(b) (5 points) Express the event E : {the sum of the numbers on the slips of paper is 4} as a subset of S.(c) (5 points) Find P(E)(d) (5 points) Let F = {the larger minus the smaller number is 0}. What is P(F )?(e) (5 points) Are E and F disjoint? Why or why not?(f) (5 points) Find P(E ∪ F )arrow_forwardIn addition to the in-school milk supplement program, the nurse would like to increase the use of daily vitamin supplements for the children by visiting homes and educating about the merits of vitamins. She believes that currently, about 50% of families with school-age children give the children a daily megavitamin. She would like to increase this to 70%. She plans a two-group study, where one group serves as a control and the other group receives her visits. How many families should she expect to visit to have 80% power of detecting this difference? Assume that drop-out rate is 5%.arrow_forward
- A recent survey of 400 americans asked whether or not parents do too much for their young adult children. The results of the survey are shown in the data file. a) Construct the frequency and relative frequency distributions. How many respondents felt that parents do too much for their adult children? What proportion of respondents felt that parents do too little for their adult children? b) Construct a pie chart. Summarize the findingsarrow_forwardThe average number of minutes Americans commute to work is 27.7 minutes (Sterling's Best Places, April 13, 2012). The average commute time in minutes for 48 cities are as follows: Click on the datafile logo to reference the data. DATA file Albuquerque 23.3 Jacksonville 26.2 Phoenix 28.3 Atlanta 28.3 Kansas City 23.4 Pittsburgh 25.0 Austin 24.6 Las Vegas 28.4 Portland 26.4 Baltimore 32.1 Little Rock 20.1 Providence 23.6 Boston 31.7 Los Angeles 32.2 Richmond 23.4 Charlotte 25.8 Louisville 21.4 Sacramento 25.8 Chicago 38.1 Memphis 23.8 Salt Lake City 20.2 Cincinnati 24.9 Miami 30.7 San Antonio 26.1 Cleveland 26.8 Milwaukee 24.8 San Diego 24.8 Columbus 23.4 Minneapolis 23.6 San Francisco 32.6 Dallas 28.5 Nashville 25.3 San Jose 28.5 Denver 28.1 New Orleans 31.7 Seattle 27.3 Detroit 29.3 New York 43.8 St. Louis 26.8 El Paso 24.4 Oklahoma City 22.0 Tucson 24.0 Fresno 23.0 Orlando 27.1 Tulsa 20.1 Indianapolis 24.8 Philadelphia 34.2 Washington, D.C. 32.8 a. What is the mean commute time for…arrow_forwardMorningstar tracks the total return for a large number of mutual funds. The following table shows the total return and the number of funds for four categories of mutual funds. Click on the datafile logo to reference the data. DATA file Type of Fund Domestic Equity Number of Funds Total Return (%) 9191 4.65 International Equity 2621 18.15 Hybrid 1419 2900 11.36 6.75 Specialty Stock a. Using the number of funds as weights, compute the weighted average total return for these mutual funds. (to 2 decimals) % b. Is there any difficulty associated with using the "number of funds" as the weights in computing the weighted average total return in part (a)? Discuss. What else might be used for weights? The input in the box below will not be graded, but may be reviewed and considered by your instructor. c. Suppose you invested $10,000 in this group of mutual funds and diversified the investment by placing $2000 in Domestic Equity funds, $4000 in International Equity funds, $3000 in Specialty Stock…arrow_forward
arrow_back_ios
SEE MORE QUESTIONS
arrow_forward_ios
Recommended textbooks for you
 Glencoe Algebra 1, Student Edition, 9780079039897...AlgebraISBN:9780079039897Author:CarterPublisher:McGraw Hill
 Big Ideas Math A Bridge To Success Algebra 1: Stu...AlgebraISBN:9781680331141Author:HOUGHTON MIFFLIN HARCOURTPublisher:Houghton Mifflin Harcourt
 Holt Mcdougal Larson Pre-algebra: Student Edition...AlgebraISBN:9780547587776Author:HOLT MCDOUGALPublisher:HOLT MCDOUGAL
Glencoe Algebra 1, Student Edition, 9780079039897...
Algebra
ISBN:9780079039897
Author:Carter
Publisher:McGraw Hill
Big Ideas Math A Bridge To Success Algebra 1: Stu...
Algebra
ISBN:9781680331141
Author:HOUGHTON MIFFLIN HARCOURT
Publisher:Houghton Mifflin Harcourt
Holt Mcdougal Larson Pre-algebra: Student Edition...
Algebra
ISBN:9780547587776
Author:HOLT MCDOUGAL
Publisher:HOLT MCDOUGAL
Mod-01 Lec-01 Discrete probability distributions (Part 1); Author: nptelhrd;https://www.youtube.com/watch?v=6x1pL9Yov1k;License: Standard YouTube License, CC-BY
Discrete Probability Distributions; Author: Learn Something;https://www.youtube.com/watch?v=m9U4UelWLFs;License: Standard YouTube License, CC-BY
Probability Distribution Functions (PMF, PDF, CDF); Author: zedstatistics;https://www.youtube.com/watch?v=YXLVjCKVP7U;License: Standard YouTube License, CC-BY
Discrete Distributions: Binomial, Poisson and Hypergeometric | Statistics for Data Science; Author: Dr. Bharatendra Rai;https://www.youtube.com/watch?v=lHhyy4JMigg;License: Standard Youtube License