
To calculate: The rate of crossover for two projects.
Introduction:
The
Answer to Problem 13QP
The crossover rate for the two projects is 10.19%. The NPV profiles show that both the projects have a higher NPV for the rate of discount below 10.19% and have a lower NPV for the rate of discount above 10.19%.
Explanation of Solution
Given information:
The details of two projects are provided. The project X cash that flows for year 1, year 2, and year 3, are $10,620, $10,900, and $10,500 respectively. The initial investment is $24,000. The project Y cash that flows for 4 years are $12,100, $9,360, $10,400 respectively and the initial investment is $24,000.
Note:
- NPV is the difference between the present values of the cash inflows from the
present value of cash outflows. - The IRR is the rate of interest, which makes the project’s NPV equal to zero. Hence, when using the available information, assume that the NPV is equal to zero and forms an equation to compute the IRR.
Equation of NPV to compute IRR by assuming that NPV is equal to zero is as follows:
Compute IRR for the project X using a spreadsheet:
Step 1:
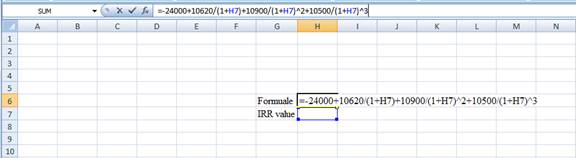
- Type the equation of NPV in H6 of the spreadsheet and consider the IRR value as H7.
Step 2:
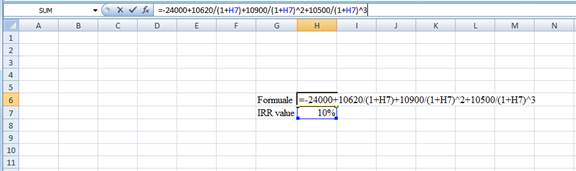
- Assume the IRR value as 10%.
Step 3:
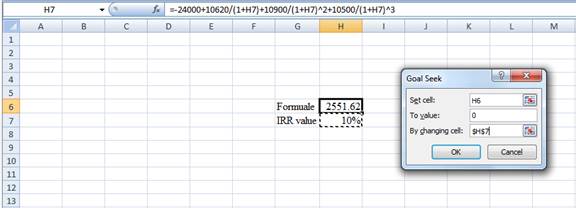
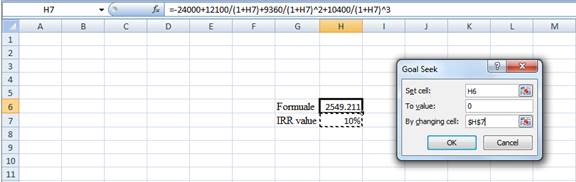
- In the spreadsheet, go to data and select the what-if-analysis.
- In what-if-analysis, select goal seek.
- In a set cell, select H6 (the Formula).
- The “To value” is considered as 0 (the assumption value for NPV).
- The H7 cell is selected for the 'by changing the cell'.
Step 4:
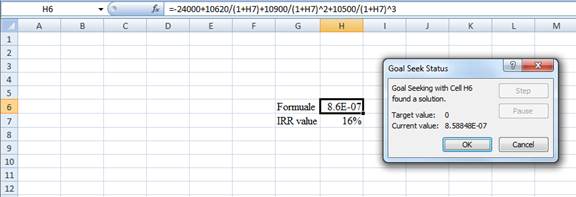
- Following the previous step click OK in the goal seek. The goal seek status appears with the IRR value
Step 5:
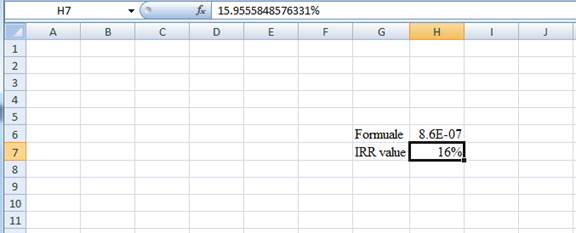
- The value appears to be 15.9555848576331%
Hence, the IRR value is 15.96%.
Compute the IRR for project Y using a spreadsheet:
Step 1:
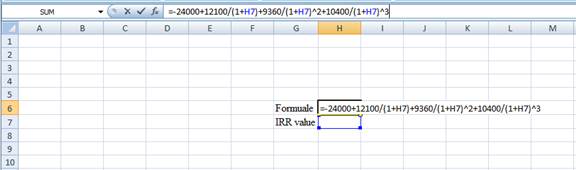
- Type the equation of NPV in H6 of the spreadsheet and consider the IRR value as H7.
Step 2:
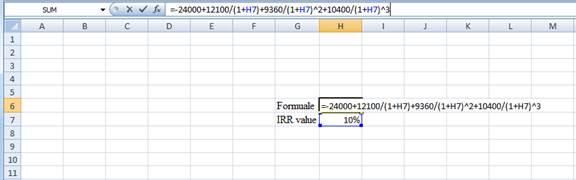
- Assume the IRR value as 10%.
Step 3:
- In the spreadsheet, go to data and select the what-if-analysis.
- In what-if-analysis, select goal seek.
- In a set cell, select H6 (the Formula).
- The “To value” is considered as 0 (the assumption value for NPV).
- The H7 cell is selected for the 'by changing the cell'.
Step 4:
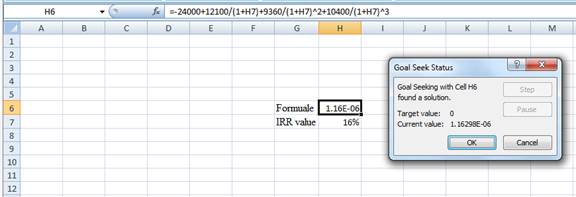
- Following the previous step click OK in the goal seek. The goal seek status appears with the IRR value.
Step 5:
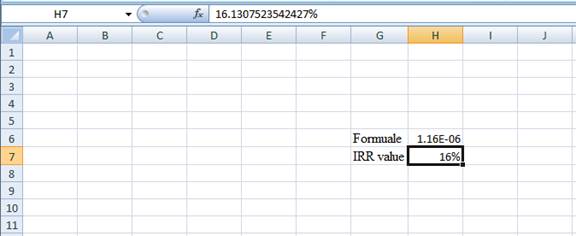
- The value appears to be 16.1307523542427%.
Hence, the IRR value is 16.13%.
Formula to compute the crossover rate is as follows:
Equation of the crossover rate to compute R is as follows:
Where,
“R” denotes crossover rate.
Compute R by using a spreadsheet:
Step 1:
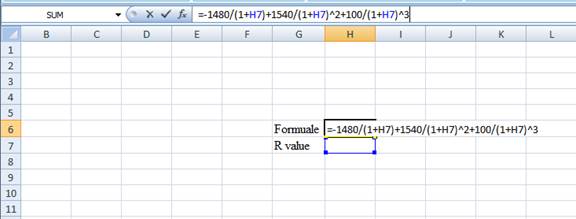
- Type the equation of NPV in H6 of the spreadsheet and consider the IRR value as H7.
Step 2:
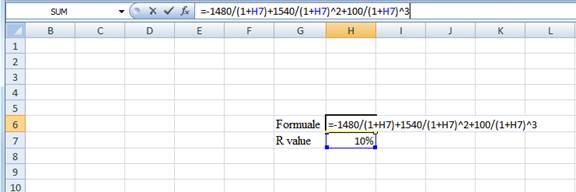
- Assume the IRR value as 10%.
Step 3:
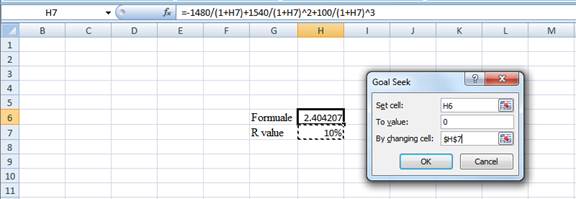
- In the spreadsheet, go to data and select the whatif analysis.
- In what-if analysis select goal seek
- In set cell select H6 (the Formula)
- The “To value” is considered as 0 (the assumption value for NPV)
- The H7 cell is selected for the by changing cell
Step 4:
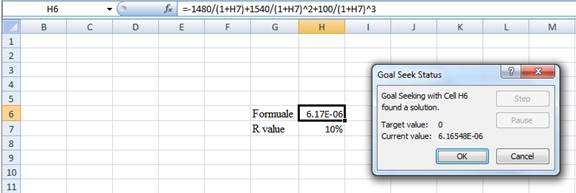
- Following the previous step click OK in the goal seek. The goal seek status appears with the IRR value.
Step 5:
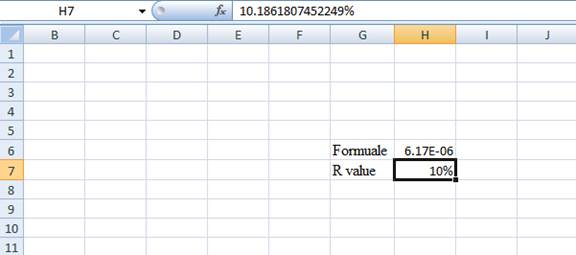
- The value appears to be 10.1861807452249%
Hence, the R-value is 10.19%.
Formula to calculate the NPV is as follows:
Note: As the discount rate is over a range of 0% to 25%, calculate NPV for 0%, 5%, 10%, 15%, 20%, and 25%.
Compute the NPV with the discount rate of 0% for the project X:
Compute the NPV with the discount rate of 0% for the project Y:
Hence, the NPV for the projects X and Y at the rate of 0% is $8,020 and $7,860 respectively.
Compute the NPV with the discount rate of 5% for the project X:
Compute the NPV with the discount rate of 5% for the project Y:
Hence, the NPV for the projects X and Y at 5% is $5071.20 and $4,997.52 respectively.
Compute the NPV with the discount rate of 10% for the project X:
Compute the NPV with the discount rate of 10% for the project Y:
Hence, the NPV for the projects X and Y at the rate of 10% is $2,551.62 and $2,549.21 respectively.
Compute the NPV with the discount rate of 15% for the project X:
Compute the NPV with the discount rate of 15% for the project Y:
Hence, the NPV for the projects X and Y at the rate of 15% is $3,80.67 and $437.41 respectively.
Compute the NPV with the discount rate of 20% for the project X:
Compute the NPV with the discount rate of 20% for the project Y:
Hence, the NPV for the projects X and Y at the rate of 20% is -$1,504.17 and -$1,398.15 respectively.
Compute the NPV with the discount rate of 25% for the project X:
Compute the NPV with the discount rate of 25% for the project Y:
Hence, the NPV for the projects X and Y at the rate of 25% is -$3,152 and -$3,004.80 respectively.
Want to see more full solutions like this?
Chapter 9 Solutions
Fundamentals of Corporate Finance

- If a business buys supplies on credit, which of the following accounts will be affected?a) Supplies and Accounts Payableb) Cash and Suppliesc) Accounts Receivable and Suppliesd) Supplies and Casharrow_forwardPlease don't solve with incorrect values . i will give unhelpful.arrow_forwardA project requires an initial investment of $100,000 and generates annual cash flows of $20,000 for 5 years. If the discount rate is 10%, what is the project's net present value (NPV)? help..??arrow_forward
- You are given the following information concerning four stocks: Using 20X0 as the base year, construct three aggregate measures of the market that simulate the Dow Jones Industrial Average, the S&P 500 stock index, and the Value Line stock index (i.e., a simple average, a value-weighted average, and a geometric average). a. What is the percentage change in each aggregate market measure from 20X0 to 20X1, and 20X0 to 20X2? Why are the results different even though only one stock’s price changed and in each case the price that changed doubled? b. If you were managing funds and wanted a source to compare your results, which market measure would you prefer to use in 20X2? *Show all work & necessary formula(s)arrow_forward7. If the inflation rate is 3% and the nominal return on an investment is 8%, what is the real return approximately? A) 5.0%B) 4.9%C) 5.2%D) 6.0%arrow_forward7. If the inflation rate is 3% and the nominal return on an investment is 8%, what is the real return approximately? A) 5.0%B) 4.9%C) 5.2%D) 6.0%need help properly.arrow_forward
- Which of the following formulas represents compound interest? A) I = PRTB) A = P(1 + rt)C) A = P(1 + r/n)^(nt)D) A = P - Ineed help!arrow_forwardWhich of the following formulas represents compound interest? A) I = PRTB) A = P(1 + rt)C) A = P(1 + r/n)^(nt)D) A = P - Iarrow_forwardA bond pays annual coupons of $60 and is currently priced at $1,050. What is its current yield? A) 6.0% B) 5.7% C) 5.5% D) 5.0% explainarrow_forward
- 8. A bond pays annual coupons of $60 and is currently priced at $1,050. What is its current yield? A) 6.0%B) 5.7%C) 5.5%D) 5.0% helparrow_forward8. A bond pays annual coupons of $60 and is currently priced at $1,050. What is its current yield? A) 6.0%B) 5.7%C) 5.5%D) 5.0%arrow_forwardWhat is the effective annual rate (EAR) if the nominal rate is 12% compounded quarterly? A) 12.55%B) 12.00%C) 12.36%D) 12.82% need help!arrow_forward
 Essentials Of InvestmentsFinanceISBN:9781260013924Author:Bodie, Zvi, Kane, Alex, MARCUS, Alan J.Publisher:Mcgraw-hill Education,

 Foundations Of FinanceFinanceISBN:9780134897264Author:KEOWN, Arthur J., Martin, John D., PETTY, J. WilliamPublisher:Pearson,
 Fundamentals of Financial Management (MindTap Cou...FinanceISBN:9781337395250Author:Eugene F. Brigham, Joel F. HoustonPublisher:Cengage Learning
 Corporate Finance (The Mcgraw-hill/Irwin Series i...FinanceISBN:9780077861759Author:Stephen A. Ross Franco Modigliani Professor of Financial Economics Professor, Randolph W Westerfield Robert R. Dockson Deans Chair in Bus. Admin., Jeffrey Jaffe, Bradford D Jordan ProfessorPublisher:McGraw-Hill Education