Concept explainers
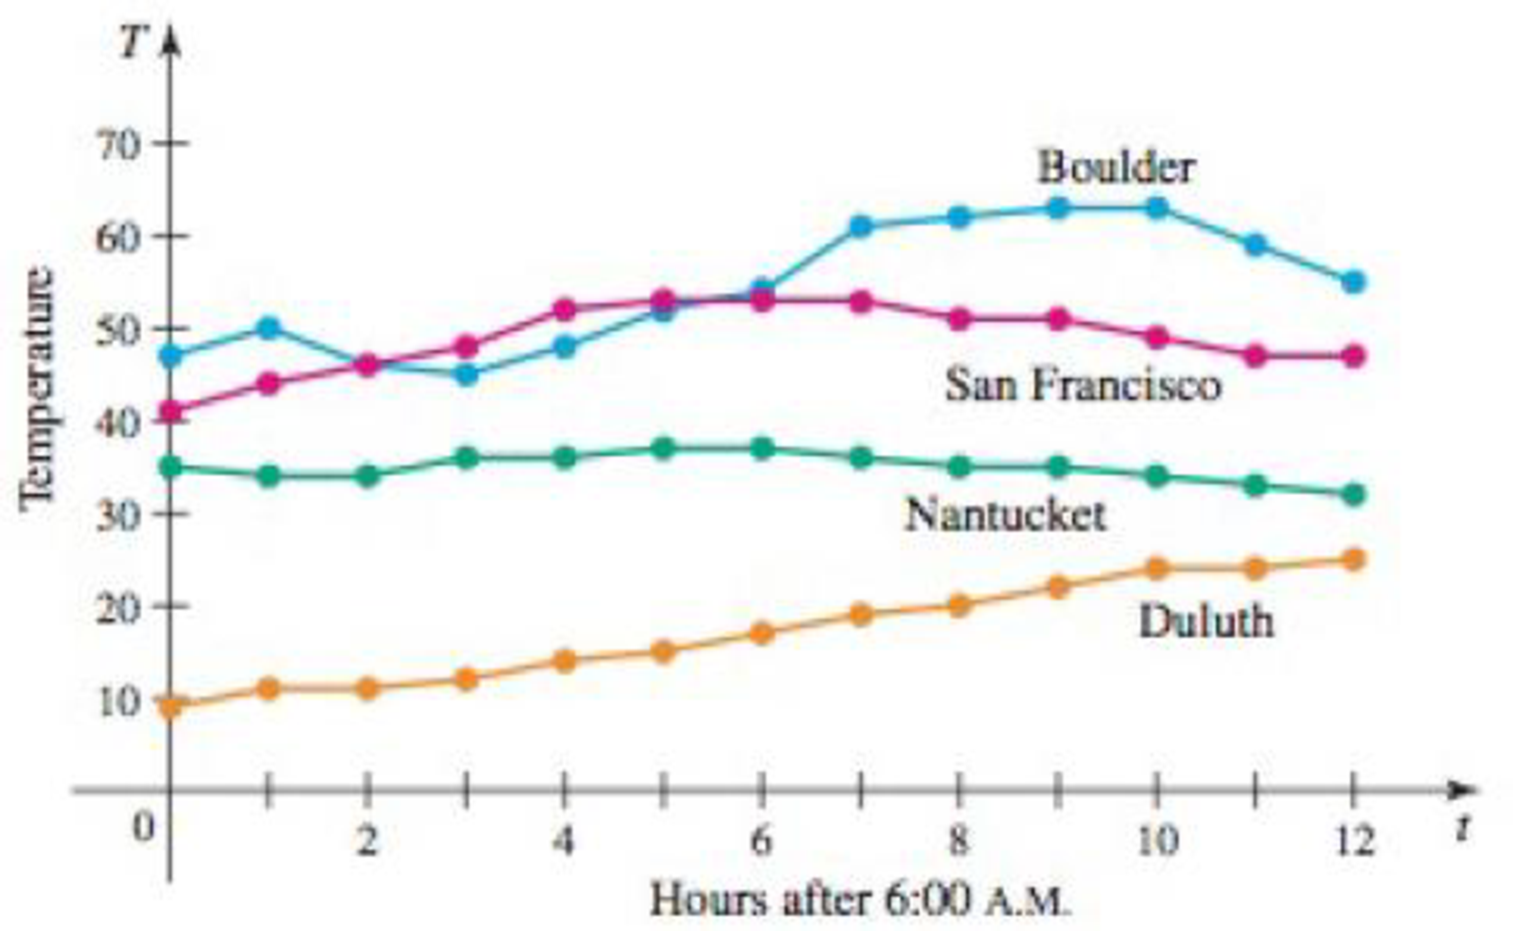
Temperature data Hourly temperature data for Boulder, Colorado. San Francisco, California. Nantucket, Massachusetts, and Duluth, Minnesota, over a 12 hr period on the same day of January are shown in the figure. Assume that these data are taken from a continuous temperature function T(t). The average temperature over the 12-hr period is


29. Find an accurate approximation to the average temperature over the 12-hr period for Nantucket. State your method.
Want to see the full answer?
Check out a sample textbook solution
Chapter 8 Solutions
MyLab Math with Pearson eText -- Standalone Access Card -- for Calculus: Early Transcendentals (3rd Edition)
Additional Math Textbook Solutions
A First Course in Probability (10th Edition)
Elementary Statistics: Picturing the World (7th Edition)
Algebra and Trigonometry (6th Edition)
College Algebra with Modeling & Visualization (5th Edition)
- Consider the graphs of y = f(x) and y = g(x) in the given diagram y= f(x). y = g(x) Evaluate (f+g)(2) -5 Determine all for which g(x) < f(x) Determine all for which f(x) +3 = g(x)arrow_forwardI) For what value(s) of x does g(x) = -4? Separate multiple answers with commas as needed. J) Give the interval(s) of such that g(x) > 0. Use the union symbol between multiple intervals. K) Give the interval(s) of such that g(x) <0. Use the union symbol between multiple intervals.arrow_forwardneed help on Barrow_forward
- 4. Use the properties of limits to help decide whether each limit exists. If a limit exists, fi lim (2x²-4x+5) a) x-4 b) lim 2 x²-16 x-4x+2x-8arrow_forward7. The concentration of a drug in a patient's bloodstream h hours after it was injected is given by 0.17 h Ah= h²+2' Find and interpret lim A(h). Remember, the answers to word problems should always be given in a complete h→00 sentence, with proper units, in the context of the problem.arrow_forward#2arrow_forward
- 2. We want to find the inverse of f(x) = (x+3)² a. On the graph at right, sketch f(x). (Hint: use what you know about transformations!) (2 points) b. What domain should we choose to get only the part of f (x) that is one- to-one and non-decreasing? Give your answer in inequality notation. (2 points) - c. Now use algebra to find f¯¹ (x). (2 points) -4- 3- 2 1 -4 -3 -2 -1 0 1 -1- -2- --3- -4 -N- 2 3 4arrow_forward1. Suppose f(x) = 2 4 == x+3 and g(x) = ½-½. Find and fully simplify ƒ(g(x)). Be sure to show all x your work, write neatly so your work is easy to follow, and connect your expressions with equals signs. (4 points)arrow_forwardFind the ane sided limit lim 2 x+1-3x-3arrow_forward
- Algebra & Trigonometry with Analytic GeometryAlgebraISBN:9781133382119Author:SwokowskiPublisher:Cengage

 Algebra: Structure And Method, Book 1AlgebraISBN:9780395977224Author:Richard G. Brown, Mary P. Dolciani, Robert H. Sorgenfrey, William L. ColePublisher:McDougal Littell
  College AlgebraAlgebraISBN:9781305115545Author:James Stewart, Lothar Redlin, Saleem WatsonPublisher:Cengage Learning
 Elementary Linear Algebra (MindTap Course List)AlgebraISBN:9781305658004Author:Ron LarsonPublisher:Cengage Learning
 Glencoe Algebra 1, Student Edition, 9780079039897...AlgebraISBN:9780079039897Author:CarterPublisher:McGraw Hill


