
Concept explainers
Videos
Between 1990 and 2013, there was a drop in violent crime and a spike in the prison population m the United States. The bar graph shows the number of violent crimes per 100,000 people and the number of imprisonments per 100,000 people for six selected years from 1990 through 2013.
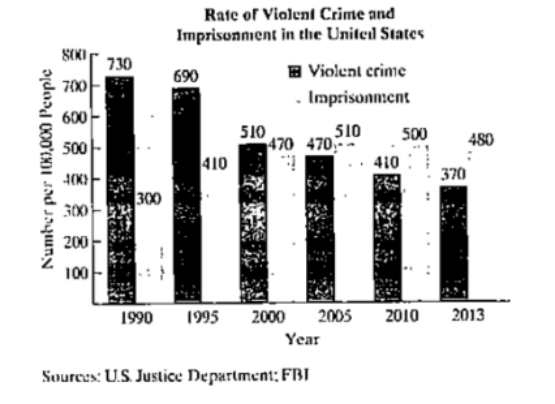
a. Based on the information in the graph, it appears that there was a year when the number of violent crimes per 100.000 Americans was the same as the number of imprisonments
per 100,000 Americans. According to the graph, between which two years did this occur?
b. The data can be modeled by quadratic and linear functions
$$$
$$$
In each function, r represents the number of years after 1990 and y represents the number per 100,000 Americans. Solve a nonlinear system to determine the year described in part (a). Bound to the nearest year. How main violent crimes per 100,000 Americans and how many imprisonments per 100,000 Americans were there in that year?
Want to see the full answer?
Check out a sample textbook solution
Chapter 8 Solutions
Algebra and Trigonometry (6th Edition)


- Jamal wants to save $48,000 for a down payment on a home. How much will he need to invest in an account with 11.8% APR, compounding daily, in order to reach his goal in 10 years? Round to the nearest dollar.arrow_forwardr nt Use the compound interest formula, A (t) = P(1 + 1)". An account is opened with an intial deposit of $7,500 and earns 3.8% interest compounded semi- annually. Round all answers to the nearest dollar. a. What will the account be worth in 10 years? $ b. What if the interest were compounding monthly? $ c. What if the interest were compounded daily (assume 365 days in a year)? $arrow_forwardKyoko has $10,000 that she wants to invest. Her bank has several accounts to choose from. Her goal is to have $15,000 by the time she finishes graduate school in 7 years. To the nearest hundredth of a percent, what should her minimum annual interest rate be in order to reach her goal assuming they compound daily? (Hint: solve the compound interest formula for the intrerest rate. Also, assume there are 365 days in a year) %arrow_forward
- 3:56 wust.instructure.com Page 0 Chapter 5 Test Form A of 2 - ZOOM + | Find any real numbers for which each expression is undefined. 2x 4 1. x Name: Date: 1. 3.x-5 2. 2. x²+x-12 4x-24 3. Evaluate when x=-3. 3. x Simplify each rational expression. x²-3x 4. 2x-6 5. x²+3x-18 x²-9 6. Write an equivalent rational expression with the given denominator. 2x-3 x²+2x+1(x+1)(x+2) Perform the indicated operation and simplify if possible. x²-16 x-3 7. 3x-9 x²+2x-8 x²+9x+20 5x+25 8. 4.x 2x² 9. x-5 x-5 3 5 10. 4x-3 8x-6 2 3 11. x-4 x+4 x 12. x-2x-8 x²-4 ← -> Copyright ©2020 Pearson Education, Inc. + 5 4. 5. 6. 7. 8. 9. 10. 11. 12. T-97arrow_forwardProblem #5 Suppose you flip a two sided fair coin ("heads" or "tails") 8 total times. a). How many ways result in 6 tails and 2 heads? b). How many ways result in 2 tails and 6 heads? c). Compare your answers to part (a) and (b) and explain in a few sentences why the comparison makes sense.arrow_forwardA local company has a 6 person management team and 20 employees. The company needs to select 3 people from the management team and 7 employees to attend a regional meeting. How many different possibilities are there for the group that can be sent to the regional meeting?arrow_forward
- I have 15 outfits to select from to pack for my business trip. I would like to select three of them to pack in my suitcase. How many packing possibilities are there?arrow_forwardThere are 15 candidates running for any of 5 distinct positions on the local school board. In how many different ways could the 5 positions be filled?arrow_forwardCelina is picking a new frame for a custom piece of artwork. She has to select a frame size, material, and color. There are four different frame sizes, three different frame materials, and six different frame colors. She must chose one option only from each category. How many different possible frames could Celina pick from?arrow_forward
- A research study in the year 2009 found that there were 2760 coyotes in a given region. The coyote population declined at a rate of 5.8% each year. How many fewer coyotes were there in 2024 than in 2015? Explain in at least one sentence how you solved the problem. Show your work. Round your answer to the nearest whole number.arrow_forwardAnswer the following questions related to the following matrix A = 3 ³).arrow_forwardExplain the following termsarrow_forward
 Glencoe Algebra 1, Student Edition, 9780079039897...AlgebraISBN:9780079039897Author:CarterPublisher:McGraw Hill
 Algebra: Structure And Method, Book 1AlgebraISBN:9780395977224Author:Richard G. Brown, Mary P. Dolciani, Robert H. Sorgenfrey, William L. ColePublisher:McDougal Littell
 Elementary AlgebraAlgebraISBN:9780998625713Author:Lynn Marecek, MaryAnne Anthony-SmithPublisher:OpenStax - Rice University
 Holt Mcdougal Larson Pre-algebra: Student Edition...AlgebraISBN:9780547587776Author:HOLT MCDOUGALPublisher:HOLT MCDOUGAL
 Intermediate AlgebraAlgebraISBN:9781285195728Author:Jerome E. Kaufmann, Karen L. SchwittersPublisher:Cengage Learning