
Statistics, Books a la Carte Edition Plus MyLab Statistics with Pearson eText -- Access Card Package (4th Edition)
4th Edition
ISBN: 9780134435855
Author: Alan Agresti, Christine A. Franklin, Bernhard Klingenberg
Publisher: PEARSON
expand_more
expand_more
format_list_bulleted
Concept explainers
Videos
Textbook Question
Chapter 8.3, Problem 35PB
Buy it now Example 6 mentioned closing prices for listings of the iPhone 5s on eBay. If you don’t feel comfortable bidding (or can’t wait until a listing has ended), you can often purchase the item right away at the indicated Buy It Now price. A random sample of Buy It Now prices for an unlocked iPhone 5s, 16GB and in new condition in July 2014 showed the following prices (in $) with dot plot and box plot shown in the figure: 618, 650, 608, 634, 675, 618, 625, 619, 630.
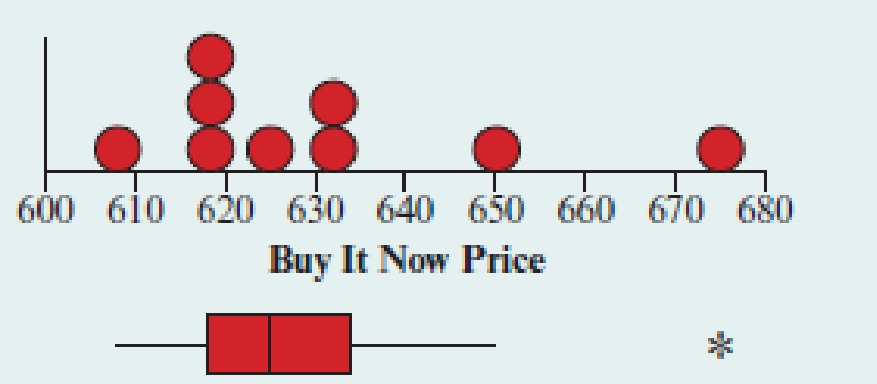
- a. What must we assume to use these data to find a 95% confidence interval for the
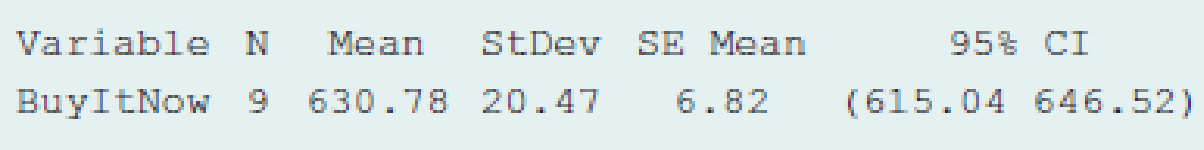
mean Buy It Now price on eBay? Do these assumptions seem plausible? - b. The table shows the way software reports results. How was the standard error of the mean (SE Mean) obtained?
- c. Interpret the 95% confidence interval in context.
- d. Compared to the confidence interval (569, 599) for prices from auctions obtained in Example 6, is there evidence that the mean price is higher when purchased through Buy It Now? Explain.
- e. Excluding the observation of $675, the confidence interval equals (615, 636). Does this change your answer to part d?
Expert Solution & Answer
Want to see the full answer?
Check out a sample textbook solution
Students have asked these similar questions
A marketing professor has surveyed the students at her university to better understand attitudes towards PPT usage for higher education. To be able to make inferences to the entire student body, the sample drawn needs to represent the university’s student population on all key characteristics. The table below shows the five key student demographic variables. The professor found the breakdown of the overall student body in the university’s fact book posted online.
A non-parametric chi-square test was used to test the sample demographics against the population percentages shown in the table above. Review the output for the five chi-square tests on the following pages and answer the five questions:
Based on the chi-square test, which sample variables adequately represent the university’s student population and which ones do not? Support your answer by providing the p-value of the chi-square test and explaining what it means.
Using the results from Question 1, make recommendation for…
A retail chain is interested in determining whether a digital video point-of-purchase (POP) display would stimulate higher sales for a brand advertised compared to the standard cardboard point-of-purchase display. To test this, a one-shot static group design experiment was conducted over a four-week period in 100 different stores. Fifty stores were randomly assigned to the control treatment (standard display) and the other 50 stores were randomly assigned to the experimental treatment (digital display). Compare the sales of the control group (standard POP) to the experimental group (digital POP).
What were the average sales for the standard POP display (control group)?
What were the sales for the digital display (experimental group)?
What is the (mean) difference in sales between the experimental group and control group?
List the null hypothesis being tested.
Do you reject or retain the null hypothesis based on the results of the independent t-test?
Was the difference between the…
What were the average sales for the four weeks prior to the experiment?
What were the sales during the four weeks when the stores used the digital display?
What is the mean difference in sales between the experimental and regular POP time periods?
State the null hypothesis being tested by the paired sample t-test.
Do you reject or retain the null hypothesis?
At a 95% significance level, was the difference significant? Explain why or why not using the results from the paired sample t-test.
Should the manager of the retail chain install new digital displays in each store? Justify your answer.
Chapter 8 Solutions
Statistics, Books a la Carte Edition Plus MyLab Statistics with Pearson eText -- Access Card Package (4th Edition)
Ch. 8.1 - Health care A study dealing with health care...Ch. 8.1 - Video on demand A recent study from Nielsen...Ch. 8.1 - Projecting winning candidate News coverage during...Ch. 8.1 - Believe in hell? Using the General Social Survey...Ch. 8.1 - Government spying In 2014, news reports worldwide...Ch. 8.1 - Game apps The Google Play app store for...Ch. 8.1 - Nutrient effect on growth rate Researchers are...Ch. 8.1 - Believe in heaven? When a GSS asked 1326 subjects,...Ch. 8.1 - Feel lonely often? The GSS has asked On how many...Ch. 8.1 - CI for loneliness Refer to the previous exercise....
Ch. 8.2 - Putin A Gallup poll of 2000 Russians taken between...Ch. 8.2 - Flu shot In a clinical study (the same as...Ch. 8.2 - How green are you? When the 2000 GSS asked...Ch. 8.2 - Make industry help environment? When the 2006 GSS...Ch. 8.2 - Favor death penalty In the 2012 General Social...Ch. 8.2 - Oppose death penalty Refer to the previous...Ch. 8.2 - Stem cell research A Harris poll of a random...Ch. 8.2 - z-score and confidence level Which z-score is used...Ch. 8.2 - Believe in ghosts A Harris poll of a random sample...Ch. 8.2 - Stem cell research and religion In Exercise 8.18,...Ch. 8.2 - Fear of breast cancer A recent survey of 1000...Ch. 8.2 - Chicken breast In a 2014 Consumer Reports article...Ch. 8.2 - Same-sex marriage A national survey by the Pew...Ch. 8.2 - Exit poll predictions A national television...Ch. 8.2 - Exit poll with smaller sample In the previous...Ch. 8.2 - Simulating confidence intervals Repeat the...Ch. 8.2 - Simulating confidence intervals with poor coverage...Ch. 8.3 - Females ideal number of children The 2012 General...Ch. 8.3 - Males ideal number of children Refer to the...Ch. 8.3 - Using t-table Using Table B, the web app, software...Ch. 8.3 - Anorexia in teenage girls A study6 compared...Ch. 8.3 - Talk time on smartphones One feature smartphone...Ch. 8.3 - Heights of seedlings Exercise 8.7 reported heights...Ch. 8.3 - Buy it now Example 6 mentioned closing prices for...Ch. 8.3 - Time spent on e-mail When the GSS asked n = 1050...Ch. 8.3 - Grandmas using e-mail For the question about...Ch. 8.3 - Prob. 38PBCh. 8.3 - Prob. 39PBCh. 8.3 - Political views The General Social Survey asks...Ch. 8.3 - Prob. 41PBCh. 8.3 - Prob. 42PBCh. 8.3 - Effect of confidence level Find the margin of...Ch. 8.3 - Prob. 44PBCh. 8.3 - Number of children For the question, How many...Ch. 8.3 - Prob. 46PBCh. 8.4 - South Africa study The researcher planning the...Ch. 8.4 - Binge drinkers A study at the Harvard School of...Ch. 8.4 - Prob. 49PBCh. 8.4 - Prob. 50PBCh. 8.4 - Prob. 51PBCh. 8.4 - Farm size An estimate is needed of the mean...Ch. 8.4 - Prob. 53PBCh. 8.4 - Prob. 54PBCh. 8.4 - Prob. 55PBCh. 8.4 - Prob. 56PBCh. 8.4 - Prob. 57PBCh. 8.4 - Prob. 58PBCh. 8.5 - Why bootstrap? Explain the purpose of using the...Ch. 8.5 - Estimating variability Refer to Example 11 about...Ch. 8.5 - Bootstrap interval for the mean In 2014, the...Ch. 8.5 - Prob. 62PBCh. 8 - Unemployed college grads The U.S Bureau of the...Ch. 8 - Prob. 64CPCh. 8 - Prob. 65CPCh. 8 - Born again A poll of a random sample of n = 2000...Ch. 8 - Life after death The variable POSTLIFE in the 2012...Ch. 8 - Prob. 68CPCh. 8 - Prob. 69CPCh. 8 - Prob. 70CPCh. 8 - Prob. 71CPCh. 8 - Wife supporting husband Consider the statement...Ch. 8 - Legalize marijuana? The General Social Survey has...Ch. 8 - Prob. 74CPCh. 8 - Streaming A Harris Poll of 2300 U.S. adults...Ch. 8 - Prob. 76CPCh. 8 - Prob. 77CPCh. 8 - Grandpas using e-mail When the GSS asked in 2012,...Ch. 8 - Prob. 79CPCh. 8 - Prob. 80CPCh. 8 - Fuel efficiency The government website...Ch. 8 - Prob. 82CPCh. 8 - Prob. 83CPCh. 8 - Prob. 84CPCh. 8 - Prob. 85CPCh. 8 - Prob. 86CPCh. 8 - Prob. 87CPCh. 8 - Revisiting mountain bikes Use the Mountain Bike...Ch. 8 - Prob. 89CPCh. 8 - Prob. 90CPCh. 8 - Prob. 91CPCh. 8 - Prob. 92CPCh. 8 - Working mother In response to the statement on a...Ch. 8 - Miami spring break For a trip to Miami, Florida,...Ch. 8 - Prob. 95CPCh. 8 - Prob. 96CPCh. 8 - Prob. 97CPCh. 8 - Prob. 98CPCh. 8 - Prob. 99CPCh. 8 - Prob. 100CPCh. 8 - Kicking accuracy A football coach decides to...Ch. 8 - Prob. 103CPCh. 8 - Prob. 104CPCh. 8 - Prob. 106CPCh. 8 - Width of a confidence interval Why are confidence...Ch. 8 - Prob. 108CPCh. 8 - Prob. 109CPCh. 8 - Prob. 110CPCh. 8 - Prob. 111CPCh. 8 - Prob. 112CPCh. 8 - Prob. 113CPCh. 8 - Prob. 114CPCh. 8 - Prob. 115CPCh. 8 - Prob. 116CPCh. 8 - Prob. 117CPCh. 8 - Prob. 118CPCh. 8 - Prob. 119CPCh. 8 - Prob. 120CPCh. 8 - Prob. 121CPCh. 8 - Prob. 122CPCh. 8 - Prob. 123CPCh. 8 - Why called degrees of freedom? You know the sample...Ch. 8 - Prob. 125CPCh. 8 - Prob. 126CPCh. 8 - Median as point estimate When the population...
Knowledge Booster


Learn more about
Need a deep-dive on the concept behind this application? Look no further. Learn more about this topic, statistics and related others by exploring similar questions and additional content below.Similar questions
- A retail chain is interested in determining whether a digital video point-of-purchase (POP) display would stimulate higher sales for a brand advertised compared to the standard cardboard point-of-purchase display. To test this, a one-shot static group design experiment was conducted over a four-week period in 100 different stores. Fifty stores were randomly assigned to the control treatment (standard display) and the other 50 stores were randomly assigned to the experimental treatment (digital display). Compare the sales of the control group (standard POP) to the experimental group (digital POP). What were the average sales for the standard POP display (control group)? What were the sales for the digital display (experimental group)? What is the (mean) difference in sales between the experimental group and control group? List the null hypothesis being tested. Do you reject or retain the null hypothesis based on the results of the independent t-test? Was the difference between the…arrow_forwardQuestion 4 An article in Quality Progress (May 2011, pp. 42-48) describes the use of factorial experiments to improve a silver powder production process. This product is used in conductive pastes to manufacture a wide variety of products ranging from silicon wafers to elastic membrane switches. Powder density (g/cm²) and surface area (cm/g) are the two critical characteristics of this product. The experiments involved three factors: reaction temperature, ammonium percentage, stirring rate. Each of these factors had two levels, and the design was replicated twice. The design is shown in Table 3. A222222222222233 Stir Rate (RPM) Ammonium (%) Table 3: Silver Powder Experiment from Exercise 13.23 Temperature (°C) Density Surface Area 100 8 14.68 0.40 100 8 15.18 0.43 30 100 8 15.12 0.42 30 100 17.48 0.41 150 7.54 0.69 150 8 6.66 0.67 30 150 8 12.46 0.52 30 150 8 12.62 0.36 100 40 10.95 0.58 100 40 17.68 0.43 30 100 40 12.65 0.57 30 100 40 15.96 0.54 150 40 8.03 0.68 150 40 8.84 0.75 30 150…arrow_forward- + ++ Table 2: Crack Experiment for Exercise 2 A B C D Treatment Combination (1) Replicate I II 7.037 6.376 14.707 15.219 |++++ 1 བྱ॰༤༠སྦྱོ སྦྱོཋཏྟཱུ a b ab 11.635 12.089 17.273 17.815 с ас 10.403 10.151 4.368 4.098 bc abc 9.360 9.253 13.440 12.923 d 8.561 8.951 ad 16.867 17.052 bd 13.876 13.658 abd 19.824 19.639 cd 11.846 12.337 acd 6.125 5.904 bcd 11.190 10.935 abcd 15.653 15.053 Question 3 Continuation of Exercise 2. One of the variables in the experiment described in Exercise 2, heat treatment method (C), is a categorical variable. Assume that the remaining factors are continuous. (a) Write two regression models for predicting crack length, one for each level of the heat treatment method variable. What differences, if any, do you notice in these two equations? (b) Generate appropriate response surface contour plots for the two regression models in part (a). (c) What set of conditions would you recommend for the factors A, B, and D if you use heat treatment method C = +? (d) Repeat…arrow_forward
- Question 2 A nickel-titanium alloy is used to make components for jet turbine aircraft engines. Cracking is a potentially serious problem in the final part because it can lead to nonrecoverable failure. A test is run at the parts producer to determine the effect of four factors on cracks. The four factors are: pouring temperature (A), titanium content (B), heat treatment method (C), amount of grain refiner used (D). Two replicates of a 24 design are run, and the length of crack (in mm x10-2) induced in a sample coupon subjected to a standard test is measured. The data are shown in Table 2. 1 (a) Estimate the factor effects. Which factor effects appear to be large? (b) Conduct an analysis of variance. Do any of the factors affect cracking? Use a = 0.05. (c) Write down a regression model that can be used to predict crack length as a function of the significant main effects and interactions you have identified in part (b). (d) Analyze the residuals from this experiment. (e) Is there an…arrow_forwardA 24-1 design has been used to investigate the effect of four factors on the resistivity of a silicon wafer. The data from this experiment are shown in Table 4. Table 4: Resistivity Experiment for Exercise 5 Run A B с D Resistivity 1 23 2 3 4 5 6 7 8 9 10 11 12 I+I+I+I+Oooo 0 0 ||++TI++o000 33.2 4.6 31.2 9.6 40.6 162.4 39.4 158.6 63.4 62.6 58.7 0 0 60.9 3 (a) Estimate the factor effects. Plot the effect estimates on a normal probability scale. (b) Identify a tentative model for this process. Fit the model and test for curvature. (c) Plot the residuals from the model in part (b) versus the predicted resistivity. Is there any indication on this plot of model inadequacy? (d) Construct a normal probability plot of the residuals. Is there any reason to doubt the validity of the normality assumption?arrow_forwardStem1: 1,4 Stem 2: 2,4,8 Stem3: 2,4 Stem4: 0,1,6,8 Stem5: 0,1,2,3,9 Stem 6: 2,2 What’s the Min,Q1, Med,Q3,Max?arrow_forward
- Are the t-statistics here greater than 1.96? What do you conclude? colgPA= 1.39+0.412 hsGPA (.33) (0.094) Find the P valuearrow_forwardA poll before the elections showed that in a given sample 79% of people vote for candidate C. How many people should be interviewed so that the pollsters can be 99% sure that from 75% to 83% of the population will vote for candidate C? Round your answer to the whole number.arrow_forwardSuppose a random sample of 459 married couples found that 307 had two or more personality preferences in common. In another random sample of 471 married couples, it was found that only 31 had no preferences in common. Let p1 be the population proportion of all married couples who have two or more personality preferences in common. Let p2 be the population proportion of all married couples who have no personality preferences in common. Find a95% confidence interval for . Round your answer to three decimal places.arrow_forward
- A history teacher interviewed a random sample of 80 students about their preferences in learning activities outside of school and whether they are considering watching a historical movie at the cinema. 69 answered that they would like to go to the cinema. Let p represent the proportion of students who want to watch a historical movie. Determine the maximal margin of error. Use α = 0.05. Round your answer to three decimal places. arrow_forwardA random sample of medical files is used to estimate the proportion p of all people who have blood type B. If you have no preliminary estimate for p, how many medical files should you include in a random sample in order to be 99% sure that the point estimate will be within a distance of 0.07 from p? Round your answer to the next higher whole number.arrow_forwardA clinical study is designed to assess the average length of hospital stay of patients who underwent surgery. A preliminary study of a random sample of 70 surgery patients’ records showed that the standard deviation of the lengths of stay of all surgery patients is 7.5 days. How large should a sample to estimate the desired mean to within 1 day at 95% confidence? Round your answer to the whole number.arrow_forward
arrow_back_ios
SEE MORE QUESTIONS
arrow_forward_ios
Recommended textbooks for you
 Glencoe Algebra 1, Student Edition, 9780079039897...AlgebraISBN:9780079039897Author:CarterPublisher:McGraw Hill
 Holt Mcdougal Larson Pre-algebra: Student Edition...AlgebraISBN:9780547587776Author:HOLT MCDOUGALPublisher:HOLT MCDOUGAL
 Big Ideas Math A Bridge To Success Algebra 1: Stu...AlgebraISBN:9781680331141Author:HOUGHTON MIFFLIN HARCOURTPublisher:Houghton Mifflin Harcourt
 Functions and Change: A Modeling Approach to Coll...AlgebraISBN:9781337111348Author:Bruce Crauder, Benny Evans, Alan NoellPublisher:Cengage Learning
Glencoe Algebra 1, Student Edition, 9780079039897...
Algebra
ISBN:9780079039897
Author:Carter
Publisher:McGraw Hill
Holt Mcdougal Larson Pre-algebra: Student Edition...
Algebra
ISBN:9780547587776
Author:HOLT MCDOUGAL
Publisher:HOLT MCDOUGAL
Big Ideas Math A Bridge To Success Algebra 1: Stu...
Algebra
ISBN:9781680331141
Author:HOUGHTON MIFFLIN HARCOURT
Publisher:Houghton Mifflin Harcourt
Functions and Change: A Modeling Approach to Coll...
Algebra
ISBN:9781337111348
Author:Bruce Crauder, Benny Evans, Alan Noell
Publisher:Cengage Learning
Correlation Vs Regression: Difference Between them with definition & Comparison Chart; Author: Key Differences;https://www.youtube.com/watch?v=Ou2QGSJVd0U;License: Standard YouTube License, CC-BY
Correlation and Regression: Concepts with Illustrative examples; Author: LEARN & APPLY : Lean and Six Sigma;https://www.youtube.com/watch?v=xTpHD5WLuoA;License: Standard YouTube License, CC-BY