
Concept explainers
Videos
Seasonal business cycle. Revenues from sales of a soft drink over a 2-year period are given approximately by
where R(t) is revenue (in millions of dollars) for a month of sales t months after February 1. The graph of the revenue function is shown in the figure.
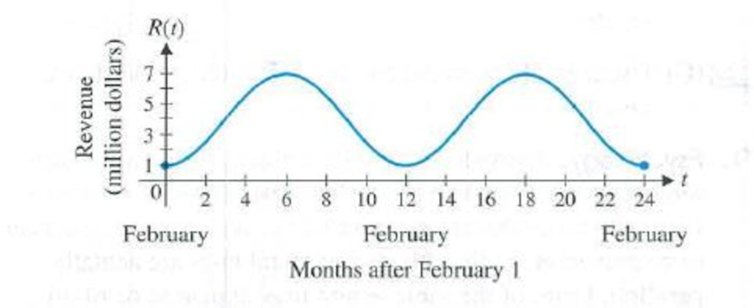
(A) Find the exact values of R(0), R(2), R(3), and R(18) without using a calculator.
(B) Use a calculator to find R(5) and R(23). Interpret the results.
(C) Use a graphing calculator to confirm the graph shown here for y = R(t).
Want to see the full answer?
Check out a sample textbook solution
Chapter 8 Solutions
FIN 108 ISU LOOSE >IP<


- 104 8 6 4 G G 2 F -10 -8 -6 -4 -2 0 2 4 6 8 10 N H -4 H 6 8 10arrow_forwardThe coordinates of AABC are shown on the coordinate plane provided. AABC is dilated from the origin by scale factor r=2. 2 3 -2 0 1 2 2 m 17arrow_forwardIn the diagram provided, AABC-AAPQ. Read each statement and then arrange the true/false statements in order. B P A Carrow_forward
- Compute the relative risk of falling for the two groups (did not stop walking vs. did stop). State/interpret your result verbally.arrow_forwardnot use ai pleasearrow_forwardlearn.edgenuity : C&C VIP Unit Test Unit Test Review Active 1 2 3 4 Which statement is true about the graph of the equation y = csc¯¹(x)? There is a horizontal asymptote at y = 0. उद There is a horizontal asymptote at y = 2. There is a vertical asymptote at x = 0. O There is a vertical asymptote at x=- R Mark this and return C Save and Exit emiarrow_forward
- Please helparrow_forwardMicrosoft Excel include formulasarrow_forwardQuestion 1 The data shown in Table 1 are and R values for 24 samples of size n = 5 taken from a process producing bearings. The measurements are made on the inside diameter of the bearing, with only the last three decimals recorded (i.e., 34.5 should be 0.50345). Table 1: Bearing Diameter Data Sample Number I R Sample Number I R 1 34.5 3 13 35.4 8 2 34.2 4 14 34.0 6 3 31.6 4 15 37.1 5 4 31.5 4 16 34.9 7 5 35.0 5 17 33.5 4 6 34.1 6 18 31.7 3 7 32.6 4 19 34.0 8 8 33.8 3 20 35.1 9 34.8 7 21 33.7 2 10 33.6 8 22 32.8 1 11 31.9 3 23 33.5 3 12 38.6 9 24 34.2 2 (a) Set up and R charts on this process. Does the process seem to be in statistical control? If necessary, revise the trial control limits. [15 pts] (b) If specifications on this diameter are 0.5030±0.0010, find the percentage of nonconforming bearings pro- duced by this process. Assume that diameter is normally distributed. [10 pts] 1arrow_forward
- Solve the initial value problem: y' = x3 + y³ 3 , y(1) = 2 xy² y(x) = Hint: Notice that the equation on the right is homogeneous and see Homework exercise 23 in section 1.2 of our textbook to review techniques for solving homogeneous equations. Note that we've been given an intial value of the form y(a) = b where a > 0, so this only determines a solution corresponding to the right half of the graph of In(x), i.e., the part of the graph corresponding to positive values of x. Therefore, we should write In(x) instead of ln(|x|), since the left half of the graph is not determined by the initial condition given.arrow_forward4. (5 pts) Conduct a chi-square contingency test (test of independence) to assess whether there is an association between the behavior of the elderly person (did not stop to talk, did stop to talk) and their likelihood of falling. Below, please state your null and alternative hypotheses, calculate your expected values and write them in the table, compute the test statistic, test the null by comparing your test statistic to the critical value in Table A (p. 713-714) of your textbook and/or estimating the P-value, and provide your conclusions in written form. Make sure to show your work. Did not stop walking to talk Stopped walking to talk Suffered a fall 12 11 Totals 23 Did not suffer a fall | 2 Totals 35 37 14 46 60 Tarrow_forwardQuestion 2 Parts manufactured by an injection molding process are subjected to a compressive strength test. Twenty samples of five parts each are collected, and the compressive strengths (in psi) are shown in Table 2. Table 2: Strength Data for Question 2 Sample Number x1 x2 23 x4 x5 R 1 83.0 2 88.6 78.3 78.8 3 85.7 75.8 84.3 81.2 78.7 75.7 77.0 71.0 84.2 81.0 79.1 7.3 80.2 17.6 75.2 80.4 10.4 4 80.8 74.4 82.5 74.1 75.7 77.5 8.4 5 83.4 78.4 82.6 78.2 78.9 80.3 5.2 File Preview 6 75.3 79.9 87.3 89.7 81.8 82.8 14.5 7 74.5 78.0 80.8 73.4 79.7 77.3 7.4 8 79.2 84.4 81.5 86.0 74.5 81.1 11.4 9 80.5 86.2 76.2 64.1 80.2 81.4 9.9 10 75.7 75.2 71.1 82.1 74.3 75.7 10.9 11 80.0 81.5 78.4 73.8 78.1 78.4 7.7 12 80.6 81.8 79.3 73.8 81.7 79.4 8.0 13 82.7 81.3 79.1 82.0 79.5 80.9 3.6 14 79.2 74.9 78.6 77.7 75.3 77.1 4.3 15 85.5 82.1 82.8 73.4 71.7 79.1 13.8 16 78.8 79.6 80.2 79.1 80.8 79.7 2.0 17 82.1 78.2 18 84.5 76.9 75.5 83.5 81.2 19 79.0 77.8 20 84.5 73.1 78.2 82.1 79.2 81.1 7.6 81.2 84.4 81.6 80.8…arrow_forward
 Algebra & Trigonometry with Analytic GeometryAlgebraISBN:9781133382119Author:SwokowskiPublisher:Cengage
 Functions and Change: A Modeling Approach to Coll...AlgebraISBN:9781337111348Author:Bruce Crauder, Benny Evans, Alan NoellPublisher:Cengage Learning

 College Algebra (MindTap Course List)AlgebraISBN:9781305652231Author:R. David Gustafson, Jeff HughesPublisher:Cengage Learning
 Trigonometry (MindTap Course List)TrigonometryISBN:9781337278461Author:Ron LarsonPublisher:Cengage Learning