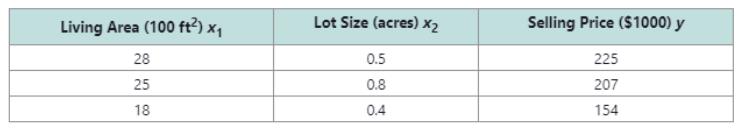
Many statistics courses cover a topic called multiple regression. This provides a means to predict the value of a dependent variable y based on two or more independent variables x 1 , x 2 , ... , x n . The model y = a x 1 + b x 2 + c is a linear model that predicts y based on two independent variables x 1 and x 2 . While statistical techniques may be used to find the values of a , b , and c based on a large number of data points, we can form a crude model given three data values x 1 , x 2 , y . Use the information given in Exercises 55-56 to form a system of three equations and three variables to solve for a , b , and c . The selling price of a homey (in $ 1000 ) is given based on the living area x 1 (in 100 ft 2 ) and on the lot size x 2 (in acres). a. Use the data to create a model of the form y = a x 1 + b x 2 + c . b. Use the model from part (a) to predict the selling price of a home that is 2000 ft 2 on a 0.4-acre lot.
Many statistics courses cover a topic called multiple regression. This provides a means to predict the value of a dependent variable y based on two or more independent variables x 1 , x 2 , ... , x n . The model y = a x 1 + b x 2 + c is a linear model that predicts y based on two independent variables x 1 and x 2 . While statistical techniques may be used to find the values of a , b , and c based on a large number of data points, we can form a crude model given three data values x 1 , x 2 , y . Use the information given in Exercises 55-56 to form a system of three equations and three variables to solve for a , b , and c . The selling price of a homey (in $ 1000 ) is given based on the living area x 1 (in 100 ft 2 ) and on the lot size x 2 (in acres). a. Use the data to create a model of the form y = a x 1 + b x 2 + c . b. Use the model from part (a) to predict the selling price of a home that is 2000 ft 2 on a 0.4-acre lot.
Solution Summary: The author explains how to calculate the selling price of a home based on the given data in the table.
Many statistics courses cover a topic called multiple regression. This provides a means to predict the value of a dependent variable
y
based on two or more independent variables
x
1
,
x
2
,
...
,
x
n
.
The model
y
=
a
x
1
+
b
x
2
+
c
is a linear model that predicts
y
based on two independent variables
x
1
and
x
2
.
While statistical techniques may be used to find the values of
a
,
b
,
and
c
based on a large number of data points, we can form a crude model given three data values
x
1
,
x
2
,
y
. Use the information given in Exercises 55-56 to form a system of three equations and three variables to solve for
a
,
b
,
and
c
.
The selling price of a homey (in
$
1000
) is given based on the living area
x
1
(in
100
ft
2
) and on the lot size
x
2
(in acres).
a. Use the data to create a model of the form
y
=
a
x
1
+
b
x
2
+
c
.
b. Use the model from part (a) to predict the selling price of a home that is
2000
ft
2
on a 0.4-acre lot.
I need help making sure that I explain this part accutartly.
Please help me with this question as I want to know how can I perform the partial fraction decompostion on this alebgric equation to find the time-domain of y(t)
Please help me with this question as I want to know how can I perform the partial fraction on this alebgric equation to find the time-domain of y(t)
Need a deep-dive on the concept behind this application? Look no further. Learn more about this topic, calculus and related others by exploring similar questions and additional content below.
Correlation Vs Regression: Difference Between them with definition & Comparison Chart; Author: Key Differences;https://www.youtube.com/watch?v=Ou2QGSJVd0U;License: Standard YouTube License, CC-BY
Correlation and Regression: Concepts with Illustrative examples; Author: LEARN & APPLY : Lean and Six Sigma;https://www.youtube.com/watch?v=xTpHD5WLuoA;License: Standard YouTube License, CC-BY


 Elementary Linear Algebra (MindTap Course List)AlgebraISBN:9781305658004Author:Ron LarsonPublisher:Cengage Learning