Statistics for Business & Economics (with XLSTAT Education Edition Printed Access Card) (MindTap Course List)
13th Edition
ISBN: 9781305585317
Author: David R. Anderson, Dennis J. Sweeney, Thomas A. Williams, Jeffrey D. Camm, James J. Cochran
Publisher: Cengage Learning
expand_more
expand_more
format_list_bulleted
Concept explainers
Videos
Textbook Question
Chapter 8.2, Problem 17E
The International Air Transport Association surveys business travelers to develop quality ratings for transatlantic gateway airports. The maximum possible rating is 10. Suppose a simple random sample of 50 business travelers is selected and each traveler is asked to provide a rating for the Miami International Airport. The ratings obtained from the sample of 50 business travelers follow.
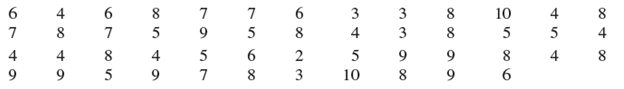
Develop a 95% confidence
Expert Solution & Answer

Trending nowThis is a popular solution!

Students have asked these similar questions
Elementary StatisticsBase on the same given data uploaded in module 4, will you conclude that the number of bathroom of houses is a significant factor for house sellprice? I your answer is affirmative, you need to explain how the number of bathroom influences the house price, using a post hoc procedure. (Please treat number of bathrooms as a categorical variable in this analysis)Base on the same given data, conduct an analysis for the variable sellprice to see if sale price is influenced by living area. Summarize your finding including all regular steps (learned in this module) for your method. Also, will you conclude that larger house corresponding to higher price (justify)?Each question need to include a spss or sas output.
Instructions:
You have to use SAS or SPSS to perform appropriate procedure: ANOVA or Regression based on the project data (provided in the module 4) and research question in the project file. Attach the computer output of all key steps (number) quoted in…
Elementary StatsBase on the given data uploaded in module 4, change the variable sale price into two categories: abovethe mean price or not; and change the living area into two categories: above the median living area ornot ( your two group should have close number of houses in each group). Using the resulting variables,will you conclude that larger house corresponding to higher price?Note: Need computer output, Ho and Ha, P and decision. If p is small, you need to explain what type ofdependency (association) we have using an appropriate pair of percentages.
Please include how to use the data in SPSS and interpretation of data.
An environmental research team is studying the daily rainfall (in millimeters) in a region over 100 days.
The data is grouped into the following histogram bins:
Rainfall Range (mm) Frequency
0-9.9
15
10 19.9
25
20-29.9
30
30-39.9
20
||40-49.9
10
a) If a random day is selected, what is the probability that the rainfall was at least 20 mm but less than 40
mm?
b) Estimate the mean daily rainfall, assuming the rainfall in each bin is uniformly distributed and the
midpoint of each bin represents the average rainfall for that range.
c) Construct the cumulative frequency distribution and determine the rainfall level below which 75% of the
days fall.
d) Calculate the estimated variance and standard deviation of the daily rainfall based on the histogram data.
Chapter 8 Solutions
Statistics for Business & Economics (with XLSTAT Education Edition Printed Access Card) (MindTap Course List)
Ch. 8.1 - A simple random sample of 40 items resulted in a...Ch. 8.1 - A simple random sample of 50 items from a...Ch. 8.1 - A simple random sample of 60 items resulted in a...Ch. 8.1 - A 95% confidence interval for a population mean...Ch. 8.1 - Data were collected on the amount spent by 64...Ch. 8.1 - In an attempt to assess total daily travel taxes...Ch. 8.1 - The average annual cost of the first year of...Ch. 8.1 - Studies show that massage therapy has a variety of...Ch. 8.1 - The mean cost to repair the smoke and fire damage...Ch. 8.1 - Costs are rising for all kinds of medical care....
Ch. 8.2 - For a t distribution with 16 degrees of freedom,...Ch. 8.2 - Find the t value(s) for each of the following...Ch. 8.2 - The following sample data are from a normal...Ch. 8.2 - A simple random sample with n = 54 provided a...Ch. 8.2 - Sales personnel for Skillings Distributors submit...Ch. 8.2 - A sample containing years to maturity and yield...Ch. 8.2 - The International Air Transport Association...Ch. 8.2 - Older people often have a hard time finding work....Ch. 8.2 - The mean cost of a meal for two in a mid-range...Ch. 8.2 - The average annual premium for automobile...Ch. 8.2 - Health insurers are beginning to offer...Ch. 8.2 - Marvel Studios motion picture Guardians of the...Ch. 8.3 - How large a sample should be selected to provide a...Ch. 8.3 - The range for a set of data is estimated to be 36....Ch. 8.3 - Refer to the Scheer Industries example in Section...Ch. 8.3 - The U.S. Energy Information Administration (US...Ch. 8.3 - Annual starting salaries for college graduates...Ch. 8.3 - Many medical professionals believe that eating too...Ch. 8.3 - Customers arrive at a movie theater at the...Ch. 8.3 - There has been a trend toward less driving in the...Ch. 8.4 - A simple random sample of 400 individuals provides...Ch. 8.4 - A simple random sample of 800 elements generates a...Ch. 8.4 - In a survey, the planning value for the population...Ch. 8.4 - At 95% confidence, how large a sample should be...Ch. 8.4 - The Consumer Reports National Research Center...Ch. 8.4 - According to statistics reported on CNBC, a...Ch. 8.4 - One of the questions on a survey of 1000 adults...Ch. 8.4 - According to Franchise business review, over 50%...Ch. 8.4 - In 16% of all homes with a stay-at-home parent,...Ch. 8.4 - For many years businesses have struggled with the...Ch. 8.4 - Fewer young people are driving. In 1983, 87% of...Ch. 8.4 - A poll for the presidential campaign sampled 491...Ch. 8.4 - The Pew Research Center Internet Project,...Ch. 8 - A sample survey of 54 discount brokers showed that...Ch. 8 - A survey conducted by the American Automobile...Ch. 8 - The 92 million Americans of age 50 and over...Ch. 8 - Russia has recently started a push for stronger...Ch. 8 - The Health Care Cost Institute tracks health care...Ch. 8 - A recent article reported that there are...Ch. 8 - Mileage tests are conducted for a particular model...Ch. 8 - In developing patient appointment schedules, a...Ch. 8 - Annual salary plus bonus data for chief executive...Ch. 8 - The National Center for Education Statistics...Ch. 8 - A USA Today/CNN/Gallup survey of 369 working...Ch. 8 - The Pew Research Center has conducted extensive...Ch. 8 - A survey of 750 likely voters in Ohio was...Ch. 8 - The Centers for Disease Control reported the...Ch. 8 - A well-known bank credit card firm wishes to...Ch. 8 - Workers in several industries were surveyed to...Ch. 8 - Although airline schedules and cost are important...Ch. 8 - Young Professional Magazine Young Professional...Ch. 8 - Gulf Real Estate Properties Gulf Real Estate...Ch. 8 - Metropolitan Research, Inc. Metropolitan Research,...
Knowledge Booster


Learn more about
Need a deep-dive on the concept behind this application? Look no further. Learn more about this topic, statistics and related others by exploring similar questions and additional content below.Similar questions
- An electronics company manufactures batches of n circuit boards. Before a batch is approved for shipment, m boards are randomly selected from the batch and tested. The batch is rejected if more than d boards in the sample are found to be faulty. a) A batch actually contains six faulty circuit boards. Find the probability that the batch is rejected when n = 20, m = 5, and d = 1. b) A batch actually contains nine faulty circuit boards. Find the probability that the batch is rejected when n = 30, m = 10, and d = 1.arrow_forwardTwenty-eight applicants interested in working for the Food Stamp program took an examination designed to measure their aptitude for social work. A stem-and-leaf plot of the 28 scores appears below, where the first column is the count per branch, the second column is the stem value, and the remaining digits are the leaves. a) List all the values. Count 1 Stems Leaves 4 6 1 4 6 567 9 3688 026799 9 8 145667788 7 9 1234788 b) Calculate the first quartile (Q1) and the third Quartile (Q3). c) Calculate the interquartile range. d) Construct a boxplot for this data.arrow_forwardPam, Rob and Sam get a cake that is one-third chocolate, one-third vanilla, and one-third strawberry as shown below. They wish to fairly divide the cake using the lone chooser method. Pam likes strawberry twice as much as chocolate or vanilla. Rob only likes chocolate. Sam, the chooser, likes vanilla and strawberry twice as much as chocolate. In the first division, Pam cuts the strawberry piece off and lets Rob choose his favorite piece. Based on that, Rob chooses the chocolate and vanilla parts. Note: All cuts made to the cake shown below are vertical.Which is a second division that Rob would make of his share of the cake?arrow_forward
- Three players (one divider and two choosers) are going to divide a cake fairly using the lone divider method. The divider cuts the cake into three slices (s1, s2, and s3). If the choosers' declarations are Chooser 1: {s1 , s2} and Chooser 2: {s2 , s3}. Using the lone-divider method, how many different fair divisions of this cake are possible?arrow_forwardTheorem 2.6 (The Minkowski inequality) Let p≥1. Suppose that X and Y are random variables, such that E|X|P <∞ and E|Y P <00. Then X+YpX+Yparrow_forwardTheorem 1.2 (1) Suppose that P(|X|≤b) = 1 for some b > 0, that EX = 0, and set Var X = 0². Then, for 0 0, P(X > x) ≤e-x+1²² P(|X|>x) ≤2e-1x+1²² (ii) Let X1, X2...., Xn be independent random variables with mean 0, suppose that P(X ≤b) = 1 for all k, and set oσ = Var X. Then, for x > 0. and 0x) ≤2 exp Σ k=1 (iii) If, in addition, X1, X2, X, are identically distributed, then P(S|x) ≤2 expl-tx+nt²o).arrow_forward
- Theorem 5.1 (Jensen's inequality) state without proof the Jensen's Ineg. Let X be a random variable, g a convex function, and suppose that X and g(X) are integrable. Then g(EX) < Eg(X).arrow_forwardCan social media mistakes hurt your chances of finding a job? According to a survey of 1,000 hiring managers across many different industries, 76% claim that they use social media sites to research prospective candidates for any job. Calculate the probabilities of the following events. (Round your answers to three decimal places.) answer parts a-c. a) Out of 30 job listings, at least 19 will conduct social media screening. b) Out of 30 job listings, fewer than 17 will conduct social media screening. c) Out of 30 job listings, exactly between 19 and 22 (including 19 and 22) will conduct social media screening. show all steps for probabilities please. answer parts a-c.arrow_forwardQuestion: we know that for rt. (x+ys s ا. 13. rs. and my so using this, show that it vye and EIXI, EIYO This : E (IX + Y) ≤2" (EIX (" + Ely!")arrow_forward
- Theorem 2.4 (The Hölder inequality) Let p+q=1. If E|X|P < ∞ and E|Y| < ∞, then . |EXY ≤ E|XY|||X|| ||||qarrow_forwardTheorem 7.6 (Etemadi's inequality) Let X1, X2, X, be independent random variables. Then, for all x > 0, P(max |S|>3x) ≤3 max P(S| > x). Isk≤narrow_forwardTheorem 7.2 Suppose that E X = 0 for all k, that Var X = 0} x) ≤ 2P(S>x 1≤k≤n S√2), -S√2). P(max Sk>x) ≤ 2P(|S|>x- 1arrow_forwardarrow_back_iosSEE MORE QUESTIONSarrow_forward_ios
Recommended textbooks for you
 Glencoe Algebra 1, Student Edition, 9780079039897...AlgebraISBN:9780079039897Author:CarterPublisher:McGraw Hill
 Big Ideas Math A Bridge To Success Algebra 1: Stu...AlgebraISBN:9781680331141Author:HOUGHTON MIFFLIN HARCOURTPublisher:Houghton Mifflin Harcourt
 College Algebra (MindTap Course List)AlgebraISBN:9781305652231Author:R. David Gustafson, Jeff HughesPublisher:Cengage Learning
 Holt Mcdougal Larson Pre-algebra: Student Edition...AlgebraISBN:9780547587776Author:HOLT MCDOUGALPublisher:HOLT MCDOUGAL
Glencoe Algebra 1, Student Edition, 9780079039897...
Algebra
ISBN:9780079039897
Author:Carter
Publisher:McGraw Hill
Big Ideas Math A Bridge To Success Algebra 1: Stu...
Algebra
ISBN:9781680331141
Author:HOUGHTON MIFFLIN HARCOURT
Publisher:Houghton Mifflin Harcourt
College Algebra (MindTap Course List)
Algebra
ISBN:9781305652231
Author:R. David Gustafson, Jeff Hughes
Publisher:Cengage Learning
Holt Mcdougal Larson Pre-algebra: Student Edition...
Algebra
ISBN:9780547587776
Author:HOLT MCDOUGAL
Publisher:HOLT MCDOUGAL
Statistics 4.1 Point Estimators; Author: Dr. Jack L. Jackson II;https://www.youtube.com/watch?v=2MrI0J8XCEE;License: Standard YouTube License, CC-BY
Statistics 101: Point Estimators; Author: Brandon Foltz;https://www.youtube.com/watch?v=4v41z3HwLaM;License: Standard YouTube License, CC-BY
Central limit theorem; Author: 365 Data Science;https://www.youtube.com/watch?v=b5xQmk9veZ4;License: Standard YouTube License, CC-BY
Point Estimate Definition & Example; Author: Prof. Essa;https://www.youtube.com/watch?v=OTVwtvQmSn0;License: Standard Youtube License
Point Estimation; Author: Vamsidhar Ambatipudi;https://www.youtube.com/watch?v=flqhlM2bZWc;License: Standard Youtube License