Concept explainers
Autism is a neurological disorder that impedes language and derails social and emotional development. New findings suggest that the condition is not a sudden calamity that strikes children at the age of 2 or 3, but a developmental problem linked to abnormally rapid brain growth during infancy. The graphs show that the heads of severely autistic children start out smaller than average and then go through a period of explosive growth. Exercises 89 -90 involve mathematical models for the data shown by the graphs.
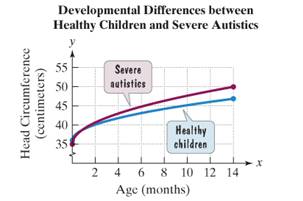
89 The data for one of me two groups shown by the graphs can be modeled by
where y is the head circumference, in centimeters, at age x months,
a. According to the model what is the head circumference at birth.
b. According to the model what is the head circumference at 9 months.
c. According to the model, what is the head circumference at 14 months? Use a calculator and round to the nearest tenth of a centimeter.
d. Use the values that you obtained in parts (a) through (c) and the graphs shown above to determine if the given model describes healthy children or severe autistics.
Want to see the full answer?
Check out a sample textbook solutionChapter 8 Solutions
Introductory Algebra for College Students (7th Edition)
- What does the y -intercept on the graph of a logistic equation correspond to for a population modeled by that equation?arrow_forwardWhat does a G01 tell a machine to perform?arrow_forwardThe university wants to know if Annual Income and Lifetime Savings are linearly related. Investigate and state your answer with evidence. Does your answer seem logical or not? Write your thoughts on this.arrow_forward
- Discuss the importance of a model being well documented.arrow_forwardA new coronavirus recently triggered a global pandemic. It spreads from 5 cases in March to tens of thousands by May in the Philippines. Case contamination is comparable to what we call exponential spread. Create a table of values representing the covid19 confirmed cases in the Philippines during the first 15 days of March 2020. You can conduct your research online and then plot the results on a Cartesian plane. You can use paper and pencil or any graphing app that is appropriate. Questions to ponder: In order to slow down the growth, what can you do to the curve? In real-life, what must be done to flatten the curve? _________________arrow_forwardSuppose that you are a researcher and wish to construct a linear mathematical (statistical) model that relates the number of years and the corresponding exports (million U.S,$) of a country. The constructed model may use to forecasts the future values. You have obtained the relevant data for a decade during 1990 to 1999 and you have listed the data in Table 5. Table 5. Shows the list of the amount that have earned on exports 6| 7| 8 Year No. 1| 2 | 3 | 4 10 Exports 4954 6131 | 6904| 6813 6803 8137| 8707 8320 8628 7779 (a) Construct a suitable graph that explains the relationship between the number of years and the corresponding exports. By inspection of the graph comment on the relationships between the number of vears and the corresponding exports. (b) Construct a mathematical (Statistical) model by using least square method between number of years and the corresponding sales. Also interpret the slope of the linear model to support your comment. (c) Forecast the value of sales by…arrow_forward
- Alcohol use in the United States increased during the first year of the COVID pandemic, as did the number of alcohol-induced deaths (such as alcoholic liver disease, accidental alcohol poisoning, disorders due to acute intoxication). Here is a figure from the CDC representing the "Rates of alcohol-induced deaths in the United States in 2020, broken down by sex and age group." Figure 2. Rates of alcohol-induced deaths, by sex and age group: United States, 2020 Age group (years) Under 25 0.1 25-34 35-44 45-54 55-64 65-74 75-84 85 and over Under 25 25-34 35-44 45-54 55-64 65-74 75-84 85 and over 0 0.3 3.9 2.9 6.4 10.2 7.9 10 12.9 12.8 16.7 20 21.0 21.8 24.5 Female Male 38.5 SOURCE: National Center for Health Statistics, National Vital Statistics System, Mortality. I 40 43.4 30 Deaths per 100,000 population 50 59.0 I 60 70 Interpret the bottom-most bar (gray bar with the value "12.8" written next to it) as a sentence in context. Enter your answer here Select ALL correct interpretations of…arrow_forward67% Outbound travel from China has tripled in the past decade 180 miion 140 100 -https://www.theatlas com/charts/mugEPIL a) What is this title referring to? b) Draw a trendline and create an equation for this data. O According to your model, when will travel double from 2018?arrow_forwardEcologists mapped a large Canadian forest plot dominated the Douglas fir, with an understory of western hemlock and western red cedar. The two-way table below records all 2,050 trees in the plot by species and life stage. Sapling trees (young trees shorter than 1.3 meters) are indicative of the future of the forest. Test the relationship between species and life stage. - When calculating the Chi-square statistic, each cell of the table makes a contribution to the total. What contribution do western red cedar saplings make? (The sum of all contributions resulted in a Chi-square statistic of 420.21) Can you explain this with table of expected counts like dead, live, sapling of western red cedar/douglas fir/western hemlock?arrow_forward
- Eloise needs to finish a 516-page report on international trade so she can present it at the big conference this weekend. She's been tracking her page count at the end of each business day to see if she's on track. Use Excel to fit a trendline to Eloise's data to create a model of her productivity. According to your model, will Eloise be able to finish her report by the end of the day next Friday? Assume she works only on weekdays. Day Pages Monday 425 Tuesday 431 Wednesday 449 Thursday 464 Friday 471 A: Use Excel to fit a trendline to Eloise's data. What are the slope and intercept for this line? The slope is The intercept is B: Use your model (trendline) to answer the question. Will Eloise finish her report by the end of next friday? Yesarrow_forward“Average adult Americans are about one inch taller, but nearly a whopping 25 pounds heavier than they were in 1960, according to a new report from the Centers for Disease Control and Prevention (CDC). The bad news, says the CDC, is that average BMI (body mass index, a weight-for-height formula used to measure obesity) has increased among adults from approximately 25 in 1960 to 28 in 2002.” Boston is considered one of America’s healthiest cities. Is the weight gain since 1960 similar in Boston? A sample of n = 25 adults suggested a mean increase of 17 pounds with a standard deviation of 8.6 pounds. Is Boston statistically significantly different in terms of weight gain since 1960? Run the appropriate test at a 5% level of significance.arrow_forwardTwins Twins are often born after a pregnancy that lastsless than 9 months. On the next page is a graph from theJournal of the American Medical Association (JAMA)showing the rate of preterm twin births in the United States over the past 20 years. In this study, JAMA catego-rized mothers by the level of prenatal medical care they received: inadequate, adequate, or intensive.a) Describe the overall trend in preterm twin births. b) Describe any differences you see in this trend, depend-ing on the level of prenatal medical care the mother received.c) Should expectant mothers be advised to cut back onthe level of medical care they seek in the hope ofavoiding preterm births? Explain.a) Create a linear model and predict the number ofgallons that will be available in 2005.b) The exam then asked students to estimate the yearwhen leaded gasoline will first become unavailable,expecting them to use the model from part a to answerthe question. Explain why that method is incorrect.c) Create a model…arrow_forward
- Algebra & Trigonometry with Analytic GeometryAlgebraISBN:9781133382119Author:SwokowskiPublisher:CengageMathematics For Machine TechnologyAdvanced MathISBN:9781337798310Author:Peterson, John.Publisher:Cengage Learning,
- Algebra: Structure And Method, Book 1AlgebraISBN:9780395977224Author:Richard G. Brown, Mary P. Dolciani, Robert H. Sorgenfrey, William L. ColePublisher:McDougal Littell