
Fundamentals of Statistics Plus MyLab Statistics with Pearson eText - Title-Specific Access Card Package (5th Edition)
5th Edition
ISBN: 9780134763729
Author: Michael Sullivan III
Publisher: PEARSON
expand_more
expand_more
format_list_bulleted
Concept explainers
Videos
Textbook Question
Chapter 8.1, Problem 42AYU
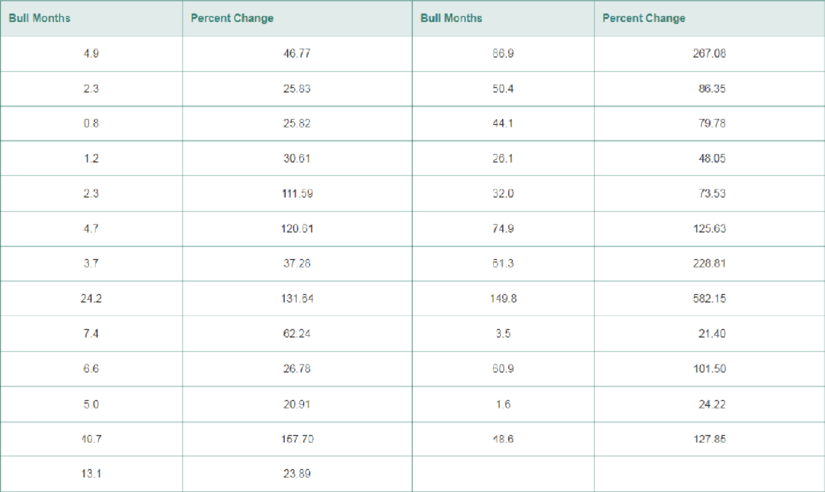
Bull Markets A bull market is defined as a market condition in which the price of a security rises for an extended period of time. A bull market in the stock market is often defined as a condition in which a market rises by 20% or more without a 20% decline. The data on the next page represent the number of months and percentage change in the S&P500 (a group of 500 stocks) during the 25 bull markets dating back to 1929 (the year of the famous market crash).
- a. Treating the length of the bull market as the explanatory variable, draw a
scatter diagram of the data. - b. Determine the linear
correlation coefficient between months and percent change. - c. Does a linear relation exist between duration of the bull market and market performance?
- d. Find the least-squares regression line treating length of the bull market as the explanatory variable.
- e. Interpret the slope.
- f. Did the bull market that lasted 50.4 months have a percent change above or below what would be expected? Explain.
- g. Draw a residual plot. Any outliers?
- h. Would you consider the bull market from December 4, 1987 through March 24, 2000, which lasted 149.8 months and saw a 582.15% rise in stock prices, influential? Explain. Note: After this bull market, the market entered a bear market that lasted 18.2 months and saw the stock market decline 37%. This era is often referred to as the ”Tech Bubble.”
Expert Solution & Answer
Want to see the full answer?
Check out a sample textbook solution
Students have asked these similar questions
math
Compute the median of the following data.
32, 41, 36, 42, 29, 30, 40, 22, 25, 37
Task Description:
Read the following case study and answer the questions that follow.
Ella is a 9-year-old third-grade student in an inclusive classroom. She has been diagnosed with Emotional and Behavioural Disorder (EBD). She has been struggling academically and socially due to
challenges related to self-regulation, impulsivity, and emotional outbursts. Ella's behaviour includes frequent tantrums, defiance toward authority figures, and difficulty forming positive relationships with peers. Despite her challenges, Ella shows an interest in art and creative activities and demonstrates strong verbal skills when calm.
Describe 2 strategies that could be implemented that could help Ella regulate her emotions in class (4 marks)
Explain 2 strategies that could improve Ella’s social skills (4 marks)
Identify 2 accommodations that could be implemented to support Ella academic progress and provide a rationale for your recommendation.(6 marks)
Provide a detailed explanation of 2 ways…
Chapter 8 Solutions
Fundamentals of Statistics Plus MyLab Statistics with Pearson eText - Title-Specific Access Card Package (5th Edition)
Ch. 8.1 - The _____ _____ of the sample mean, x, is the...Ch. 8.1 - Suppose a simple random sample of size n is drawn...Ch. 8.1 - The standard deviation of the sampling...Ch. 8.1 - True or False: The distribution of the sample...Ch. 8.1 - True or False: The distribution of the sample...Ch. 8.1 - True or False: To cut the standard error of the...Ch. 8.1 - A simple random sample of size n = 10 is obtained...Ch. 8.1 - A simple random sample of size n = 40 is obtained...Ch. 8.1 - In Problems 912, determine x and x from the given...Ch. 8.1 - In Problems 912, determine x and x from the given...
Ch. 8.1 - In Problems 912, determine x and x from the given...Ch. 8.1 - In Problems 912, determine x and x from the given...Ch. 8.1 - Answer the following questions for the sampling...Ch. 8.1 - Answer the following questions for the sampling...Ch. 8.1 - A simple random sample of size n = 49 is obtained...Ch. 8.1 - A simple random sample of size n = 36 is obtained...Ch. 8.1 - A simple random sample of size n = 12 is obtained...Ch. 8.1 - A simple random sample of size n = 20 is obtained...Ch. 8.1 - NW Gestation Period The length of human...Ch. 8.1 - Upper Leg Length The upper leg length of 20- to...Ch. 8.1 - Reading Rates The reading speed of second grade...Ch. 8.1 - Old Faithful The most famous geyser in the world....Ch. 8.1 - Rates of Return in Stocks The SP 500 is a...Ch. 8.1 - Winning Poker A very good poker player is expected...Ch. 8.1 - NW Oil Change The shape of the distribution of the...Ch. 8.1 - Time Spent in the Drive-Through The...Ch. 8.1 - Insect Fragments The Food and Drug Administration...Ch. 8.1 - Burger Kings Drive-Through Suppose that cars...Ch. 8.1 - Watching Television The amount of time Americans...Ch. 8.1 - ATM Withdrawals According to Crown ATM Network,...Ch. 8.1 - Sampling Distributions The following data...Ch. 8.1 - Sampling Distributions The following data...Ch. 8.1 - Putting It Together: Playing Roulette In the game...Ch. 8.1 - Explain what a sampling distribution is.Ch. 8.1 - State the Central Limit Theorem.Ch. 8.1 - We assume that we are obtaining simple random...Ch. 8.1 - Without doing any computation, decide which has a...Ch. 8.1 - For the three probability distributions shown,...Ch. 8.1 - Suppose Jack and Diane are each attempting to use...Ch. 8.1 - Sleepy Suppose you want to study the number of...Ch. 8.1 - Sleepy Again Suppose you want to study the number...Ch. 8.1 - Bull Markets A bull market is defined as a market...Ch. 8.2 - In a town of 500 households, 220 have a dog. The...Ch. 8.2 - The _____ _____, denoted p, is given by the...Ch. 8.2 - True or False: The population proportion and...Ch. 8.2 - True or False: The mean of the sampling...Ch. 8.2 - Describe the circumstances under which the shape...Ch. 8.2 - What happens to the standard deviation of p as the...Ch. 8.2 - In Problems 710, describe the sampling...Ch. 8.2 - In Problems 710, describe the sampling...Ch. 8.2 - In Problems 710, describe the sampling...Ch. 8.2 - In Problems 710, describe the sampling...Ch. 8.2 - A simple random sample of size n = 75 is obtained...Ch. 8.2 - A simple random sample of size n = 200 is obtained...Ch. 8.2 - Prob. 13AYUCh. 8.2 - A simple random sample of size n = 1460 is...Ch. 8.2 - Foreign Language According to a study done by...Ch. 8.2 - Are You Satisfied? According to a study done by...Ch. 8.2 - NW Marriage Obsolete? According to a study done by...Ch. 8.2 - Credit Cards According to creditcard.com, 29% of...Ch. 8.2 - Afraid to Fly According to a study conducted by...Ch. 8.2 - Having Children? The Pew Research Center recently...Ch. 8.2 - Election Prediction Exit polling is a popular...Ch. 8.2 - Acceptance Sampling A shipment of 50,000...Ch. 8.2 - Social Security Reform A researcher studying...Ch. 8.2 - Prob. 24AYUCh. 8.2 - Reincarnation Suppose 21% of all American teens...Ch. 8.2 - Assessments Consider the homeowners association...Ch. 8.2 - Airline Reservations In Chapter 6, We learned that...Ch. 8.2 - Finite Population Correction Factor In this...Ch. 8.2 - Fumbles The New England Patriots made headlines...Ch. 8 - In your own words, explain what a sampling...Ch. 8 - Prob. 2RECh. 8 - Under what conditions is the sampling distribution...Ch. 8 - Prob. 4RECh. 8 - Energy Need during Pregnancy The total energy need...Ch. 8 - Copper Tubing A machine at KA Tube Manufacturing...Ch. 8 - Number of Televisions Based on data obtained from...Ch. 8 - Entrepreneurship A Gallup survey indicated that...Ch. 8 - Advanced Degrees According to the U.S. Census...Ch. 8 - Variability in Baseball Suppose, during the course...Ch. 8 - Prob. 1CTCh. 8 - Prob. 2CTCh. 8 - The charge life of a certain lithium ion battery...Ch. 8 - A machine used for filling plastic bottles with a...Ch. 8 - Prob. 5CTCh. 8 - Prob. 6CTCh. 8 - Prob. 7CTCh. 8 - Using statistical software, generate 250 samples...Ch. 8 - Prob. 2CSCh. 8 - Prob. 3CSCh. 8 - Prob. 4CSCh. 8 - Prob. 5CSCh. 8 - Prob. 6CSCh. 8 - Prob. 7CSCh. 8 - Prob. 8CSCh. 8 - Prob. 9CSCh. 8 - Prob. 10CSCh. 8 - Prob. 11CSCh. 8 - Prob. 12CSCh. 8 - Repeat parts 11 and 12 for samples of size 20...Ch. 8 - Prob. 14CSCh. 8 - How do the averages of your sample means compare...Ch. 8 - Prob. 16CSCh. 8 - Prob. 17CSCh. 8 - Construct histograms for each column of summary...Ch. 8 - Prob. 19CS
Knowledge Booster


Learn more about
Need a deep-dive on the concept behind this application? Look no further. Learn more about this topic, statistics and related others by exploring similar questions and additional content below.Similar questions
- Question 2: When John started his first job, his first end-of-year salary was $82,500. In the following years, he received salary raises as shown in the following table. Fill the Table: Fill the following table showing his end-of-year salary for each year. I have already provided the end-of-year salaries for the first three years. Calculate the end-of-year salaries for the remaining years using Excel. (If you Excel answer for the top 3 cells is not the same as the one in the following table, your formula / approach is incorrect) (2 points) Geometric Mean of Salary Raises: Calculate the geometric mean of the salary raises using the percentage figures provided in the second column named “% Raise”. (The geometric mean for this calculation should be nearly identical to the arithmetic mean. If your answer deviates significantly from the mean, it's likely incorrect. 2 points) Starting salary % Raise Raise Salary after raise 75000 10% 7500 82500 82500 4% 3300…arrow_forwardI need help with this problem and an explanation of the solution for the image described below. (Statistics: Engineering Probabilities)arrow_forwardI need help with this problem and an explanation of the solution for the image described below. (Statistics: Engineering Probabilities)arrow_forward
- 310015 K Question 9, 5.2.28-T Part 1 of 4 HW Score: 85.96%, 49 of 57 points Points: 1 Save of 6 Based on a poll, among adults who regret getting tattoos, 28% say that they were too young when they got their tattoos. Assume that six adults who regret getting tattoos are randomly selected, and find the indicated probability. Complete parts (a) through (d) below. a. Find the probability that none of the selected adults say that they were too young to get tattoos. 0.0520 (Round to four decimal places as needed.) Clear all Final check Feb 7 12:47 US Oarrow_forwardhow could the bar graph have been organized differently to make it easier to compare opinion changes within political partiesarrow_forwardDraw a picture of a normal distribution with mean 70 and standard deviation 5.arrow_forward
- What do you guess are the standard deviations of the two distributions in the previous example problem?arrow_forwardPlease answer the questionsarrow_forward30. An individual who has automobile insurance from a certain company is randomly selected. Let Y be the num- ber of moving violations for which the individual was cited during the last 3 years. The pmf of Y isy | 1 2 4 8 16p(y) | .05 .10 .35 .40 .10 a.Compute E(Y).b. Suppose an individual with Y violations incurs a surcharge of $100Y^2. Calculate the expected amount of the surcharge.arrow_forward
- 24. An insurance company offers its policyholders a num- ber of different premium payment options. For a ran- domly selected policyholder, let X = the number of months between successive payments. The cdf of X is as follows: F(x)=0.00 : x < 10.30 : 1≤x<30.40 : 3≤ x < 40.45 : 4≤ x <60.60 : 6≤ x < 121.00 : 12≤ x a. What is the pmf of X?b. Using just the cdf, compute P(3≤ X ≤6) and P(4≤ X).arrow_forward59. At a certain gas station, 40% of the customers use regular gas (A1), 35% use plus gas (A2), and 25% use premium (A3). Of those customers using regular gas, only 30% fill their tanks (event B). Of those customers using plus, 60% fill their tanks, whereas of those using premium, 50% fill their tanks.a. What is the probability that the next customer will request plus gas and fill the tank (A2 B)?b. What is the probability that the next customer fills the tank?c. If the next customer fills the tank, what is the probability that regular gas is requested? Plus? Premium?arrow_forward38. Possible values of X, the number of components in a system submitted for repair that must be replaced, are 1, 2, 3, and 4 with corresponding probabilities .15, .35, .35, and .15, respectively. a. Calculate E(X) and then E(5 - X).b. Would the repair facility be better off charging a flat fee of $75 or else the amount $[150/(5 - X)]? [Note: It is not generally true that E(c/Y) = c/E(Y).]arrow_forward
arrow_back_ios
SEE MORE QUESTIONS
arrow_forward_ios
Recommended textbooks for you
 Holt Mcdougal Larson Pre-algebra: Student Edition...AlgebraISBN:9780547587776Author:HOLT MCDOUGALPublisher:HOLT MCDOUGAL
 Linear Algebra: A Modern IntroductionAlgebraISBN:9781285463247Author:David PoolePublisher:Cengage Learning
 College Algebra (MindTap Course List)AlgebraISBN:9781305652231Author:R. David Gustafson, Jeff HughesPublisher:Cengage Learning
 College AlgebraAlgebraISBN:9781305115545Author:James Stewart, Lothar Redlin, Saleem WatsonPublisher:Cengage Learning
 Functions and Change: A Modeling Approach to Coll...AlgebraISBN:9781337111348Author:Bruce Crauder, Benny Evans, Alan NoellPublisher:Cengage Learning
Holt Mcdougal Larson Pre-algebra: Student Edition...
Algebra
ISBN:9780547587776
Author:HOLT MCDOUGAL
Publisher:HOLT MCDOUGAL
Linear Algebra: A Modern Introduction
Algebra
ISBN:9781285463247
Author:David Poole
Publisher:Cengage Learning
College Algebra (MindTap Course List)
Algebra
ISBN:9781305652231
Author:R. David Gustafson, Jeff Hughes
Publisher:Cengage Learning
College Algebra
Algebra
ISBN:9781305115545
Author:James Stewart, Lothar Redlin, Saleem Watson
Publisher:Cengage Learning
Functions and Change: A Modeling Approach to Coll...
Algebra
ISBN:9781337111348
Author:Bruce Crauder, Benny Evans, Alan Noell
Publisher:Cengage Learning
Mod-01 Lec-01 Discrete probability distributions (Part 1); Author: nptelhrd;https://www.youtube.com/watch?v=6x1pL9Yov1k;License: Standard YouTube License, CC-BY
Discrete Probability Distributions; Author: Learn Something;https://www.youtube.com/watch?v=m9U4UelWLFs;License: Standard YouTube License, CC-BY
Probability Distribution Functions (PMF, PDF, CDF); Author: zedstatistics;https://www.youtube.com/watch?v=YXLVjCKVP7U;License: Standard YouTube License, CC-BY
Discrete Distributions: Binomial, Poisson and Hypergeometric | Statistics for Data Science; Author: Dr. Bharatendra Rai;https://www.youtube.com/watch?v=lHhyy4JMigg;License: Standard Youtube License