Horngren's Financial & Managerial Accounting, The Financial Chapters (Book & Access Card)
5th Edition
ISBN: 9780134078939
Author: Tracie L. Miller-Nobles, Brenda L. Mattison, Ella Mae Matsumura
Publisher: PEARSON
expand_more
expand_more
format_list_bulleted
Textbook Question
Chapter 8, Problem 8.25E
Evaluating ratio data
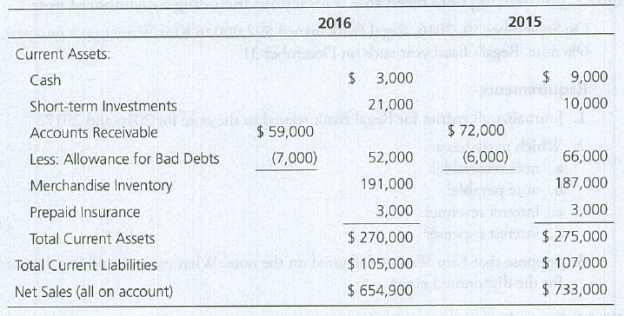
Chippewa Carpets reported the following amounts in its 2016 financial statements. The 2015 figures are given for comparison.

Requirements
- 1. Calculate Chippewa’s acid-test ratio for 2016. (Round to two decimals.) Determine whether Chippewa’s acid-test ratio improved or deteriorated from 2015 to 2016. How does Chippewa’s acid-test ratio compare with the industry average of 0.80?
- 2. Calculate Chippewa’s
accounts receivable turnover ratio. (Round to two decimals.) How does Chippewa’s ratio compare to the industry average accounts receivable turnover of 10? - 3. Calculate the days’ sales in receivables for 2016. (Round to the nearest day.) How do the results compare with Chippewa’s credit terms of net 30?
Expert Solution & Answer
Trending nowThis is a popular solution!

Students have asked these similar questions
Write down as many descriptions describing rock and roll that you can.
From these descriptions can you come up with s denition of rock and roll?
What performers do you recognize?
What performers don’t you recognize?
What can you say about musical inuence on these current rock musicians?
Try to break these inuences into genres and relate them to the rock musicians. What does
Mick Jagger say about country artists?
What does pioneering mean?
What kind of ensembles w
Recently, Abercrombie & Fitch has been implementing a turnaround strategy since its sales had been falling for the past few years (11% decrease in 2014, 8% in 2015, and just 3% in 2016.) One part of Abercrombie's new strategy has been to abandon its logo-adorned merchandise, replacing it with a subtler look. Abercrombie wrote down $20.6 million of inventory, including logo-adorned merchandise, during the year ending January 30, 2016. Some of this inventory dated back to late 2013. The write-down was net of the amount it would be able to recover selling the inventory at a discount. The write-down is significant; Abercrombie's reported net income after this write-down was $35.6 million. Interestingly, Abercrombie excluded the inventory write-down from its non-GAAP income measures presented to investors; GAAP earnings were also included in the same report. Question: What impact would the write-down of inventory have had on Abercrombie's expenses, Gross margin, and Net income?
Recently, Abercrombie & Fitch has been implementing a turnaround strategy since its sales had been falling for the past few years (11% decrease in 2014, 8% in 2015, and just 3% in 2016.) One part of Abercrombie's new strategy has been to abandon its logo-adorned merchandise, replacing it with a subtler look. Abercrombie wrote down $20.6 million of inventory, including logo-adorned merchandise, during the year ending January 30, 2016. Some of this inventory dated back to late 2013. The write-down was net of the amount it would be able to recover selling the inventory at a discount. The write-down is significant; Abercrombie's reported net income after this write-down was $35.6 million. Interestingly, Abercrombie excluded the inventory write-down from its non-GAAP income measures presented to investors; GAAP earnings were also included in the same report. Question: What impact would the write-down of inventory have had on Abercrombie's assets, Liabilities, and Equity?
Chapter 8 Solutions
Horngren's Financial & Managerial Accounting, The Financial Chapters (Book & Access Card)
Ch. 8 - Prob. 1QCCh. 8 - When recording credit card or debit card sales...Ch. 8 - Which of the following is a limitation of the...Ch. 8 - The entry to record a write-off of an...Ch. 8 - Brickman Corporation uses the allowance method to...Ch. 8 - Brickmans ending balance of Accounts Receivable is...Ch. 8 - At December 31 year-end, Crain Corporation has an...Ch. 8 - Using the data in the preceding question, what...Ch. 8 - At year-end, Schultz, Inc. has cash of 11,600,...Ch. 8 - Using the data in the preceding question, assume...
Ch. 8 - What is the difference between accounts receivable...Ch. 8 - Prob. 2RQCh. 8 - Prob. 3RQCh. 8 - When dealing with receivables, give an example of...Ch. 8 - What type of account must the sum of all...Ch. 8 - Prob. 6RQCh. 8 - What are two common methods used when accepting...Ch. 8 - What occurs when a business factors its...Ch. 8 - What occurs when a business pledges its...Ch. 8 - Prob. 10RQCh. 8 - Prob. 11RQCh. 8 - Prob. 12RQCh. 8 - Prob. 13RQCh. 8 - When using the allowance method, how are accounts...Ch. 8 - Prob. 15RQCh. 8 - Prob. 16RQCh. 8 - How does the percent- of-sales method compute bad...Ch. 8 - How do the percent-of-receivables and aging-of-...Ch. 8 - What is the difference between the...Ch. 8 - Prob. 20RQCh. 8 - Prob. 21RQCh. 8 - Prob. 22RQCh. 8 - Prob. 23RQCh. 8 - Prob. 24RQCh. 8 - Prob. 8.1SECh. 8 - Prob. 8.2SECh. 8 - Applying the direct write-off method to account...Ch. 8 - Collecting a receivable previously written...Ch. 8 - Prob. 8.5SECh. 8 - Applying the allowance method (percent-of-sales)...Ch. 8 - Applying the allowance method...Ch. 8 - Prob. 8.8SECh. 8 - Prob. 8.9SECh. 8 - Accounting for a note receivable On June 6,...Ch. 8 - Prob. 8.11SECh. 8 - Recording a dishonored note receivable Midway...Ch. 8 - Prob. 8.13SECh. 8 - Defining common receivables terms Match the terms...Ch. 8 - Prob. 8.15ECh. 8 - Journalizing transactions using the direct...Ch. 8 - Use the following information to answer Exercises...Ch. 8 - Use the following information to answer Exercises...Ch. 8 - Accounting for uncollectible accounts using the...Ch. 8 - Journalizing transactions using the direct...Ch. 8 - Journalizing credit card sales, note receivable...Ch. 8 - Journalizing note receivable transactions...Ch. 8 - Journalizing note receivable transactions The...Ch. 8 - Journalizing note receivable transactions Like New...Ch. 8 - Evaluating ratio data Chippewa Carpets reported...Ch. 8 - Prob. 8.26ECh. 8 - Prob. 8.27APCh. 8 - Accounting for uncollectible accounts using the...Ch. 8 - Accounting for uncollectible accounts using the...Ch. 8 - Accounting for uncollectible accounts...Ch. 8 - Accounting for notes receivable and accruing...Ch. 8 - Accounting for notes receivable, dishonored notes,...Ch. 8 - Using ratio data to evaluate a companys financial...Ch. 8 - Prob. 8.34BPCh. 8 - Prob. 8.35BPCh. 8 - Accounting for uncollectible accounts using the...Ch. 8 - Accounting for uncollectible accounts...Ch. 8 - Accounting for notes receivable and accruing...Ch. 8 - Accounting for notes receivable, dishonored notes,...Ch. 8 - Prob. 8.40BPCh. 8 - Prob. 8.41CPCh. 8 - Prob. 8.42PSCh. 8 - Prob. 8.1CTDCCh. 8 - Paulines Pottery has always used the direct...Ch. 8 - Prob. 8.1CTFCCh. 8 - Use Starbucks Corporations Fiscal 2013 Annual...
Knowledge Booster
Learn more about
Need a deep-dive on the concept behind this application? Look no further. Learn more about this topic, accounting and related others by exploring similar questions and additional content below.Similar questions
arrow_back_ios
SEE MORE QUESTIONS
arrow_forward_ios
Recommended textbooks for you
 Cornerstones of Financial AccountingAccountingISBN:9781337690881Author:Jay Rich, Jeff JonesPublisher:Cengage Learning
 Financial AccountingAccountingISBN:9781305088436Author:Carl Warren, Jim Reeve, Jonathan DuchacPublisher:Cengage Learning
 Principles of Accounting Volume 1AccountingISBN:9781947172685Author:OpenStaxPublisher:OpenStax College

Cornerstones of Financial Accounting
Accounting
ISBN:9781337690881
Author:Jay Rich, Jeff Jones
Publisher:Cengage Learning

Financial Accounting
Accounting
ISBN:9781305088436
Author:Carl Warren, Jim Reeve, Jonathan Duchac
Publisher:Cengage Learning


Principles of Accounting Volume 1
Accounting
ISBN:9781947172685
Author:OpenStax
Publisher:OpenStax College

How To Analyze an Income Statement; Author: Daniel Pronk;https://www.youtube.com/watch?v=uVHGgSXtQmE;License: Standard Youtube License