EXCURSIONS IN MOD.MATH W/ACCESS >BI<
9th Edition
ISBN: 9781323788721
Author: Tannenbaum
Publisher: PEARSON C
expand_more
expand_more
format_list_bulleted
Videos
Textbook Question
Chapter 8, Problem 52E
Consider the project digraph shown in
a. Schedule the project with
b. Explain why the schedule obtained in (a) is optimal.
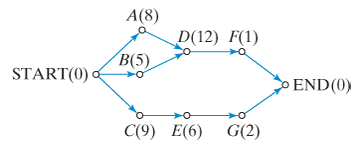
Figure 8-40
Expert Solution & Answer
Want to see the full answer?
Check out a sample textbook solution
Students have asked these similar questions
The average miles per gallon for a sample of 40 cars of model SX last year was 32.1, with a population standard deviation of 3.8. A sample of 40 cars from this year’s model SX has an average of 35.2 mpg, with a population standard deviation of 5.4.
Find a 99 percent confidence interval for the difference in average mpg for this car brand (this year’s model minus last year’s).Find a 99 percent confidence interval for the difference in average mpg for last year’s model minus this year’s. What does the negative difference mean?
A special interest group reports a tiny margin of error (plus or minus 0.04 percent) for its online survey based on 50,000 responses. Is the margin of error legitimate? (Assume that the group’s math is correct.)
Suppose that 73 percent of a sample of 1,000 U.S. college students drive a used car as opposed to a new car or no car at all.
Find an 80 percent confidence interval for the percentage of all U.S. college students who drive a used car.What sample size would cut this margin of error in half?
Chapter 8 Solutions
EXCURSIONS IN MOD.MATH W/ACCESS >BI<
Ch. 8 - For the digraph shown in Fig. 8-25, find a.the...Ch. 8 - For the digraph shown in Fig. 8-26, find Figure...Ch. 8 - For the digraph in Fig. 8-25, find a.all path of...Ch. 8 - For the digraph in Fig. 8-26, find a.a path of...Ch. 8 - For the digraph in Fig. 8-25, find a.all cycles of...Ch. 8 - For the digraph in Fig. 8-26, find a.all cycles of...Ch. 8 - Prob. 7ECh. 8 - For the digraph in Fig.8-26, find a.all vertices...Ch. 8 - a.Draw a digraph with vertex-set V={A,B,C,D} and...Ch. 8 - a.Draw a digraph with vertex-set V={A,B,C,D} and...
Ch. 8 - Prob. 11ECh. 8 - Consider the digraph with vertex-set V={V,W,X,Y,Z}...Ch. 8 - Prob. 13ECh. 8 - Prob. 14ECh. 8 - Prob. 15ECh. 8 - A mathematics textbook consists of 10 chapters....Ch. 8 - Prob. 17ECh. 8 - The digraph in Fig. 8-29 is an example of a...Ch. 8 - Prob. 19ECh. 8 - Wobble, a start-up company, is developing a search...Ch. 8 - A project consists of eight tasks labeled A...Ch. 8 - A project consists of eight tasks labeled A...Ch. 8 - Prob. 23ECh. 8 - Prob. 24ECh. 8 - Prob. 25ECh. 8 - A ballroom is to be set up for a large wedding...Ch. 8 - Prob. 27ECh. 8 - Prob. 28ECh. 8 - Exercises 29 through 32 refer to a project...Ch. 8 - Exercises 29 through 32 refer to a project...Ch. 8 - Prob. 31ECh. 8 - Exercises 29 through 32 refer to a project...Ch. 8 - Prob. 33ECh. 8 - Exercises33 and 34 refer to the Martian Habitat...Ch. 8 - Prob. 35ECh. 8 - Prob. 36ECh. 8 - Prob. 37ECh. 8 - Using the priority list G,F,E,D,C,B,A, schedule...Ch. 8 - Prob. 39ECh. 8 - Using the priority list G,F,E,D,C,B,A, schedule...Ch. 8 - Prob. 41ECh. 8 - Prob. 42ECh. 8 - Prob. 43ECh. 8 - Use the decreasing-time algorithm to schedule the...Ch. 8 - Prob. 45ECh. 8 - Use the decreasing-time algorithm to schedule the...Ch. 8 - Prob. 47ECh. 8 - Consider the project described by the digraph...Ch. 8 - Consider the project described by the digraph...Ch. 8 - Consider the project described by the digraph...Ch. 8 - Consider the project digraph shown in Fig.8-40....Ch. 8 - Consider the project digraph shown in Fig.8-40....Ch. 8 - Prob. 53ECh. 8 - Consider the project digraph shown in Fig.8-41....Ch. 8 - Schedule the Apartments Unlimited project given in...Ch. 8 - Schedule the project given in Exercise26 Table8-5...Ch. 8 - Consider the project described by the project...Ch. 8 - Consider the project digraph shown in Fig.8-43,...Ch. 8 - Prob. 59ECh. 8 - Symmetric and totally asymmetric digraphs. A...Ch. 8 - Prob. 61ECh. 8 - Let W represent the sum of the processing times of...Ch. 8 - You have N=2 processors to process M independent...Ch. 8 - You have N=3 processors to process M independent...Ch. 8 - You have N=2 processor to process M+1 independent...
Knowledge Booster


Learn more about
Need a deep-dive on the concept behind this application? Look no further. Learn more about this topic, subject and related others by exploring similar questions and additional content below.Similar questions
- You want to compare the average number of tines on the antlers of male deer in two nearby metro parks. A sample of 30 deer from the first park shows an average of 5 tines with a population standard deviation of 3. A sample of 35 deer from the second park shows an average of 6 tines with a population standard deviation of 3.2. Find a 95 percent confidence interval for the difference in average number of tines for all male deer in the two metro parks (second park minus first park).Do the parks’ deer populations differ in average size of deer antlers?arrow_forwardSuppose that you want to increase the confidence level of a particular confidence interval from 80 percent to 95 percent without changing the width of the confidence interval. Can you do it?arrow_forwardA random sample of 1,117 U.S. college students finds that 729 go home at least once each term. Find a 98 percent confidence interval for the proportion of all U.S. college students who go home at least once each term.arrow_forward
- Suppose that you make two confidence intervals with the same data set — one with a 95 percent confidence level and the other with a 99.7 percent confidence level. Which interval is wider?Is a wide confidence interval a good thing?arrow_forwardIs it true that a 95 percent confidence interval means you’re 95 percent confident that the sample statistic is in the interval?arrow_forwardTines can range from 2 to upwards of 50 or more on a male deer. You want to estimate the average number of tines on the antlers of male deer in a nearby metro park. A sample of 30 deer has an average of 5 tines, with a population standard deviation of 3. Find a 95 percent confidence interval for the average number of tines for all male deer in this metro park.Find a 98 percent confidence interval for the average number of tines for all male deer in this metro park.arrow_forward
- Based on a sample of 100 participants, the average weight loss the first month under a new (competing) weight-loss plan is 11.4 pounds with a population standard deviation of 5.1 pounds. The average weight loss for the first month for 100 people on the old (standard) weight-loss plan is 12.8 pounds, with population standard deviation of 4.8 pounds. Find a 90 percent confidence interval for the difference in weight loss for the two plans( old minus new) Whats the margin of error for your calculated confidence interval?arrow_forwardA 95 percent confidence interval for the average miles per gallon for all cars of a certain type is 32.1, plus or minus 1.8. The interval is based on a sample of 40 randomly selected cars. What units represent the margin of error?Suppose that you want to decrease the margin of error, but you want to keep 95 percent confidence. What should you do?arrow_forwardLet v₁ = (2,-3,7,8), v2 = (3, 10, -6, 14), v3 = (0, 19, -2, 16), and v₁ = (9, -2, 1, 10). Is the set {V1, V2, V3, V4} a basis for R4? Of the two sets S = {(3x-5y, 4x + 7y, x+9y): x, y = R} and T = {2x-3y+z, -7x-3y²+z, 4x + 3z): x, y, z = R} which is a subspace of R3? (S, T, both, neither) Justify.arrow_forward
- Can you help me solve this?arrow_forwardFind a basis and dimension for the null space of the following matrix: 3 -2 0 7 -2 1-1 1 5 3 19-2 8 06 1 -2 -4 -5-6 -9 4-6 11 6 Find a basis and dimension for the column space of the same matrix (above).arrow_forward3. (i) Below is the R code for performing a X2 test on a 2×3 matrix of categorical variables called TestMatrix: chisq.test(Test Matrix) (a) Assuming we have a significant result for this procedure, provide the R code (including any required packages) for an appropriate post hoc test. (b) If we were to apply this technique to a 2 × 2 case, how would we adapt the code in order to perform the correct test? (ii) What procedure can we use if we want to test for association when we have ordinal variables? What code do we use in R to do this? What package does this command belong to? (iii) The following code contains the initial steps for a scenario where we are looking to investigate the relationship between age and whether someone owns a car by using frequencies. There are two issues with the code - please state these. Row3<-c(75,15) Row4<-c(50,-10) MortgageMatrix<-matrix(c(Row1, Row4), byrow=T, nrow=2, MortgageMatrix dimnames=list(c("Yes", "No"), c("40 or older","<40")))…arrow_forward
arrow_back_ios
SEE MORE QUESTIONS
arrow_forward_ios
Recommended textbooks for you
 Algebra & Trigonometry with Analytic GeometryAlgebraISBN:9781133382119Author:SwokowskiPublisher:Cengage
 Linear Algebra: A Modern IntroductionAlgebraISBN:9781285463247Author:David PoolePublisher:Cengage Learning
Algebra & Trigonometry with Analytic Geometry
Algebra
ISBN:9781133382119
Author:Swokowski
Publisher:Cengage
Linear Algebra: A Modern Introduction
Algebra
ISBN:9781285463247
Author:David Poole
Publisher:Cengage Learning
Graph Theory: Euler Paths and Euler Circuits; Author: Mathispower4u;https://www.youtube.com/watch?v=5M-m62qTR-s;License: Standard YouTube License, CC-BY
WALK,TRIAL,CIRCUIT,PATH,CYCLE IN GRAPH THEORY; Author: DIVVELA SRINIVASA RAO;https://www.youtube.com/watch?v=iYVltZtnAik;License: Standard YouTube License, CC-BY