
Concept explainers
Videos
Using Past Information to Estimate Required Returns
Use online resources to work on this chapter's questions. Please note that website information changes over time, and these changes may limit your ability to answer some of these questions.
Chapter 8 discussed the basic trade-off between risk and return. In the
As mentioned in Web Appendix 8A, beta can be estimated by regressing the individual stock's returns against the returns of the overall market. As an alternative to running our own regressions, we can rely on reported betas from a variety of sources. These published sources make it easy for us to readily obtain beta estimates for most large publicly traded corporations. However, a word of caution is in order. Beta estimates can often be quite sensitive to the time period in which the data are estimated, the market index used, and the frequency of the data used. Therefore, it is not uncommon to find a wide range of beta estimates among the various Internet websites.
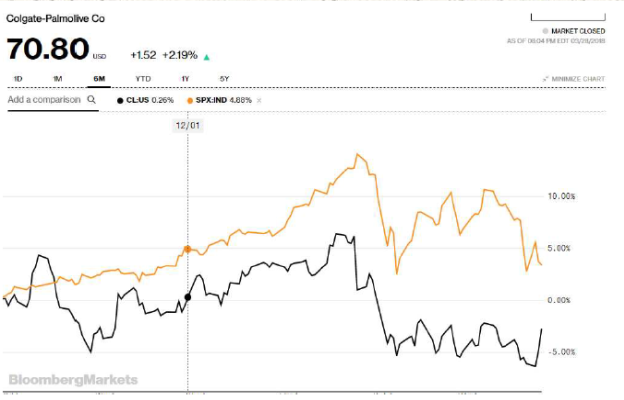
4. Select one of the four stocks listed in question 3 by entering the company's ticker symbol on the financial website you have chosen. On the screen you should see the interactive chart. Select the six-month time period and compare the stock's performance to the S&P 500's performance on the graph by adding the S&P 500 to the interactive chart. Has the stock outperformed or underperformed the overall market during this time period?
Want to see the full answer?
Check out a sample textbook solution
Chapter 8 Solutions
Bundle: Fundamentals Of Financial Management, Loose-leaf Version, 15th + Mindtapv2.0 Finance, 1 Term (6 Months) Printed Access Card


- Sonja Jensen is considering the purchase of a fast-food franchise. Sonja will be operating on a lot that is to be converted into a parking lot in six years, but that may be rented in the interim for $700 per month. The franchise and necessary equipment will have a total initial cost of $68,000 and a salvage value of $9,000 (in today's dollars) after six years. Sonja is told that the future annual general inflation rate will be 5%. The projected operating revenues and expenses (in actual dollars) other than rent and depreciation for the business are given in the table below. Assume that the initial investment will be depreciated under the five-year MACRS and that Sonja's tax rate will be 30%. Sonja can invest her money at a rate of at least 14% in other investment activities during this inflation-ridden period. Click the icon to view the projected operating revenues and expenses. Click the icon to view the MACRS depreciation schedules. (a) Determine the cash flows associated with the…arrow_forwardUnit 02 Part 3: New City BandAs the volunteer business manager for the New City Band (City Band), you are responsible for preparing the operating budget for the organization’s upcoming summer concert season. Each year, City Band presents up to 20 weekend performances, depending on weather conditions. The concerts are free to the public,but the band hangs a pot from the bandstand and people leave small donations in it. On average, City Band gets $100 in donations at each of its performances. In addition to donations, New City pays the band $3,000 per season plus $125 for each performance.City Band also has a small endowment of $100,000 on which it expects to earn 3.5 percent in the coming fiscal year. City Band’s trustees have decided to use that money to pay for operating expenses if they need to.City Band pays its conductor $3,000 for the summer season and has aninsurance policy to protect it against any loss of equipment or damage to the bandstand. That policy costs the band…arrow_forwardhow to solvearrow_forward
- How much working capital does Airbnb have for the year 2024? Discuss the components of working capital and calculations. What is the amount of the total assets that Airbnb reported for the year 2024? List the assets included. What is the amount of the total liabilities that tAirbnb reported for the year 2024? List the liabilities included.arrow_forwardHow much working capital does Airbnb have for the year 2024? State the components of working capital and calculations. What is the amount of the total assets that Airbnb reported for the year of 2024 and list the assets?arrow_forwardWhat is an account that requires present value calculations. State both the account name and the amount for the account you select. What inventory method does Airbnb employ and explain how this method works? Calculate Airbnb inventory turnover for the year 2024. What does inventory turnover tells an investor?arrow_forward
- What was the free cash flow for the year 2024 for Airbnb and formula used for their calculations? Explain the importance of free cash flow.arrow_forwardWhat is the useful lives for the various types of property, plant, and equipment owned by Airbnb?arrow_forwardWhat depreciation method does Airbnb employ and how does this depreciation method works? Does Airbnb have any impaired assets?arrow_forward
- New City BandAs the volunteer business manager for the New City Band (City Band), you are responsible for preparing the operating budget for the organization’s upcoming summer concert season. Each year, City Band presents up to 20 weekend performances, depending on weather conditions. The concerts are free to the public,but the band hangs a pot from the bandstand and people leave small donations in it. On average, City Band gets $100 in donations at each of its performances. In addition to donations, New City pays the band $3,000 per season plus $125 for each performance.City Band also has a small endowment of $100,000 on which it expects to earn 3.5 percent in the coming fiscal year. City Band’s trustees have decided to use that money to pay for operating expenses if they need to.City Band pays its conductor $3,000 for the summer season and has aninsurance policy to protect it against any loss of equipment or damage to the bandstand. That policy costs the band $500 for the summer plus…arrow_forwardWhat are asset type and the useful lives for a company mean?arrow_forwardWhat was the amount of cash (and cash equivalents) that Airbnb reported for the year of 2024? State the amounts for each item you included in this number. How much working capital does Airbnb have for the year 2024? State the components of working capital and calculations. What is the amount of the total assets that Airbnb reported for the year of 2024 and list the assets?arrow_forward
 Fundamentals of Financial Management (MindTap Cou...FinanceISBN:9781337395250Author:Eugene F. Brigham, Joel F. HoustonPublisher:Cengage Learning
 EBK CONTEMPORARY FINANCIAL MANAGEMENTFinanceISBN:9781337514835Author:MOYERPublisher:CENGAGE LEARNING - CONSIGNMENT
 Essentials of Business Analytics (MindTap Course ...StatisticsISBN:9781305627734Author:Jeffrey D. Camm, James J. Cochran, Michael J. Fry, Jeffrey W. Ohlmann, David R. AndersonPublisher:Cengage Learning
 Pfin (with Mindtap, 1 Term Printed Access Card) (...FinanceISBN:9780357033609Author:Randall Billingsley, Lawrence J. Gitman, Michael D. JoehnkPublisher:Cengage Learning
 Intermediate Financial Management (MindTap Course...FinanceISBN:9781337395083Author:Eugene F. Brigham, Phillip R. DavesPublisher:Cengage Learning