
Concept explainers
Videos
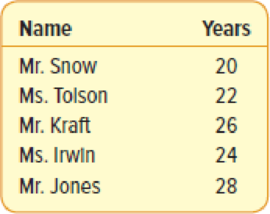
The years of service of the five executives employed by Standard Chemicals are:
- (a) Using the combination formula, how many
samples of size 2 are possible? - (b) List all possible samples of two executives from the population and compute their means.
- (c) Organize the means into a sampling distribution.
- (d) Compare the population
mean and the mean of the sample means. - (e) Compare the dispersion in the population with that in the distribution of the sample mean.
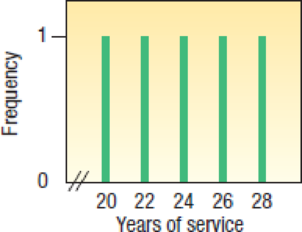
- (f) A chart portraying the population values follows. Is the distribution of population values
normally distributed (bell-shaped)?
- (g) Is the distribution of the sample mean computed in part (c) starting to show some tendency toward being bell-shaped?
a.
Find the possible number of samples of size 2 using combination formula.
Answer to Problem 3SR
The possible number of samples of size 2 using combination formula is 10.
Explanation of Solution
From the given information, the years of service of the five executives are 20, 22, 26, 24 and 28.
The possible number of different samples of size two is obtained by using the following formula:
Substitute 5 for the N and 2 for the n
Then,
Thus, the possible number of samples of size 2 using combination formula is 10.
b.
Give the all possible samples of two executives.
Find the mean of each sample.
Answer to Problem 3SR
Thus, all possible samples of two executives are
Thus, the mean of each sample is 21, 23, 22, 24, 24, 23, 25, 25, 27 and 26.
Explanation of Solution
The mean is calculated by using the following formula:
| Sample | Mean |
Thus, all possible samples of size 2 are
Thus, the mean of each sample is 21, 23, 22, 24, 24, 23, 25, 25, 27 and 26.
c.
Construct the sampling distribution for the means.
Answer to Problem 3SR
The sampling distribution for the means is
Explanation of Solution
The sampling distribution for the means is as follows:
| Sample mean | Frequency | Probability |
| 21 | 1 | |
| 22 | 1 | |
| 23 | 2 | |
| 24 | 2 | |
| 25 | 2 | |
| 26 | 1 | |
| 27 | 1 | |
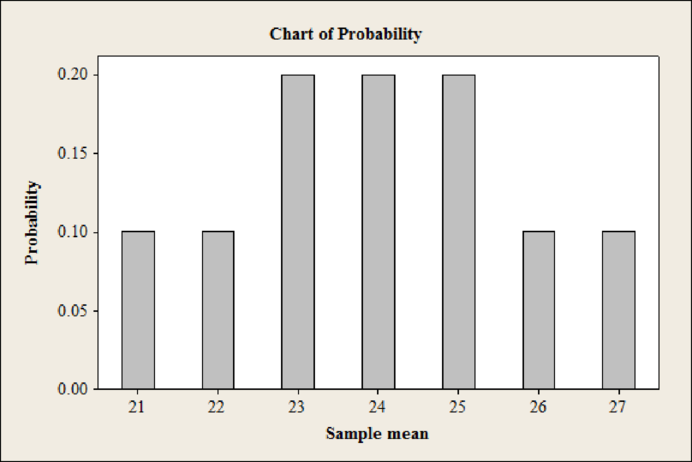
Software procedure:
Step-by-step procedure to obtain the bar chart using MINITAB:
- Choose Stat > Graph > Bar chart.
- Under Bars represent, enter select Values from a table.
- Under One column of values select Simple.
- Click on OK.
- Under Graph variables enter probability and under categorical variable enter sample mean.
- Click OK.
Output using MINITAB software is given below:

d.
Give the comparison between the population mean and the mean of the sample means.
Answer to Problem 3SR
The mean of the distribution of the sample means is equal to the population mean.
Explanation of Solution
Population mean is calculated as follows:
The mean of the sample means is calculated as follows:
Comparison:
The mean of the distribution of the sample mean is 24 and the population mean is 24. The two means are exactly same.
Thus, the mean of the distribution of the sample means is equal to the population mean.
e.
Give the dispersion in the population with that in the distribution of the sample mean.
Answer to Problem 3SR
The dispersion in the population is greater than with that of the sample mean.
Explanation of Solution
The population values are 20, 22, 26, 24 and 28. From the part b, the mean of each sample is 21, 23, 22, 24, 24, 23, 25, 25, 27 and 26.
The population values are between 20 and 28. The sample mean values are between 21 and 27.
Thus, the dispersion in the population is greater than with that of the sample mean.
f.
Check whether the distribution of population values is normally distributed or not.
Answer to Problem 3SR
The distribution of population values is not normally distributed.
Explanation of Solution
From the given chart, the frequency of all the years of service is at same level. Then, the distribution of the population values is uniform.
Thus, the distribution of population values is not normally distributed.
g.
Check whether the distribution of the sample mean computed in part (c) starting to show some tendency toward being bell-shaped or not.
Answer to Problem 3SR
The distribution of the sample mean computed in part (c) starting to show some tendency toward being bell-shaped.
Explanation of Solution
From the part (c), it can be observed that the shape of the bar chart is bell shaped.
Thus, the distribution of the sample mean computed in part (c) starting to show some tendency toward being bell-shaped.
Want to see more full solutions like this?
Chapter 8 Solutions
Loose Leaf for Statistical Techniques in Business and Economics (Mcgraw-hill/Irwin Series in Operations and Decision Sciences)


- I need help with this problem and an explanation of the solution for the image described below. (Statistics: Engineering Probabilities)arrow_forward310015 K Question 9, 5.2.28-T Part 1 of 4 HW Score: 85.96%, 49 of 57 points Points: 1 Save of 6 Based on a poll, among adults who regret getting tattoos, 28% say that they were too young when they got their tattoos. Assume that six adults who regret getting tattoos are randomly selected, and find the indicated probability. Complete parts (a) through (d) below. a. Find the probability that none of the selected adults say that they were too young to get tattoos. 0.0520 (Round to four decimal places as needed.) Clear all Final check Feb 7 12:47 US Oarrow_forwardhow could the bar graph have been organized differently to make it easier to compare opinion changes within political partiesarrow_forward
- 30. An individual who has automobile insurance from a certain company is randomly selected. Let Y be the num- ber of moving violations for which the individual was cited during the last 3 years. The pmf of Y isy | 1 2 4 8 16p(y) | .05 .10 .35 .40 .10 a.Compute E(Y).b. Suppose an individual with Y violations incurs a surcharge of $100Y^2. Calculate the expected amount of the surcharge.arrow_forward24. An insurance company offers its policyholders a num- ber of different premium payment options. For a ran- domly selected policyholder, let X = the number of months between successive payments. The cdf of X is as follows: F(x)=0.00 : x < 10.30 : 1≤x<30.40 : 3≤ x < 40.45 : 4≤ x <60.60 : 6≤ x < 121.00 : 12≤ x a. What is the pmf of X?b. Using just the cdf, compute P(3≤ X ≤6) and P(4≤ X).arrow_forward59. At a certain gas station, 40% of the customers use regular gas (A1), 35% use plus gas (A2), and 25% use premium (A3). Of those customers using regular gas, only 30% fill their tanks (event B). Of those customers using plus, 60% fill their tanks, whereas of those using premium, 50% fill their tanks.a. What is the probability that the next customer will request plus gas and fill the tank (A2 B)?b. What is the probability that the next customer fills the tank?c. If the next customer fills the tank, what is the probability that regular gas is requested? Plus? Premium?arrow_forward
- 38. Possible values of X, the number of components in a system submitted for repair that must be replaced, are 1, 2, 3, and 4 with corresponding probabilities .15, .35, .35, and .15, respectively. a. Calculate E(X) and then E(5 - X).b. Would the repair facility be better off charging a flat fee of $75 or else the amount $[150/(5 - X)]? [Note: It is not generally true that E(c/Y) = c/E(Y).]arrow_forward74. The proportions of blood phenotypes in the U.S. popula- tion are as follows:A B AB O .40 .11 .04 .45 Assuming that the phenotypes of two randomly selected individuals are independent of one another, what is the probability that both phenotypes are O? What is the probability that the phenotypes of two randomly selected individuals match?arrow_forward53. A certain shop repairs both audio and video compo- nents. Let A denote the event that the next component brought in for repair is an audio component, and let B be the event that the next component is a compact disc player (so the event B is contained in A). Suppose that P(A) = .6 and P(B) = .05. What is P(BA)?arrow_forward
 Glencoe Algebra 1, Student Edition, 9780079039897...AlgebraISBN:9780079039897Author:CarterPublisher:McGraw Hill
 Big Ideas Math A Bridge To Success Algebra 1: Stu...AlgebraISBN:9781680331141Author:HOUGHTON MIFFLIN HARCOURTPublisher:Houghton Mifflin Harcourt
 Functions and Change: A Modeling Approach to Coll...AlgebraISBN:9781337111348Author:Bruce Crauder, Benny Evans, Alan NoellPublisher:Cengage Learning