
Concept explainers
Videos
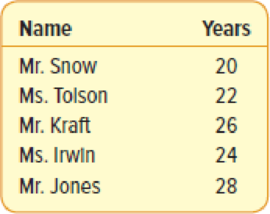
The years of service of the five executives employed by Standard Chemicals are:
- (a) Using the combination formula, how many
samples of size 2 are possible? - (b) List all possible samples of two executives from the population and compute their means.
- (c) Organize the means into a sampling distribution.
- (d) Compare the population
mean and the mean of the sample means. - (e) Compare the dispersion in the population with that in the distribution of the sample mean.
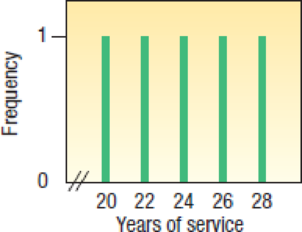
- (f) A chart portraying the population values follows. Is the distribution of population values
normally distributed (bell-shaped)?
- (g) Is the distribution of the sample mean computed in part (c) starting to show some tendency toward being bell-shaped?
a.
Find the possible number of samples of size 2 using combination formula.
Answer to Problem 3SR
The possible number of samples of size 2 using combination formula is 10.
Explanation of Solution
From the given information, the years of service of the five executives are 20, 22, 26, 24 and 28.
The possible number of different samples of size two is obtained by using the following formula:
Substitute 5 for the N and 2 for the n
Then,
Thus, the possible number of samples of size 2 using combination formula is 10.
b.
Give the all possible samples of two executives.
Find the mean of each sample.
Answer to Problem 3SR
Thus, all possible samples of two executives are
Thus, the mean of each sample is 21, 23, 22, 24, 24, 23, 25, 25, 27 and 26.
Explanation of Solution
The mean is calculated by using the following formula:
| Sample | Mean |
Thus, all possible samples of size 2 are
Thus, the mean of each sample is 21, 23, 22, 24, 24, 23, 25, 25, 27 and 26.
c.
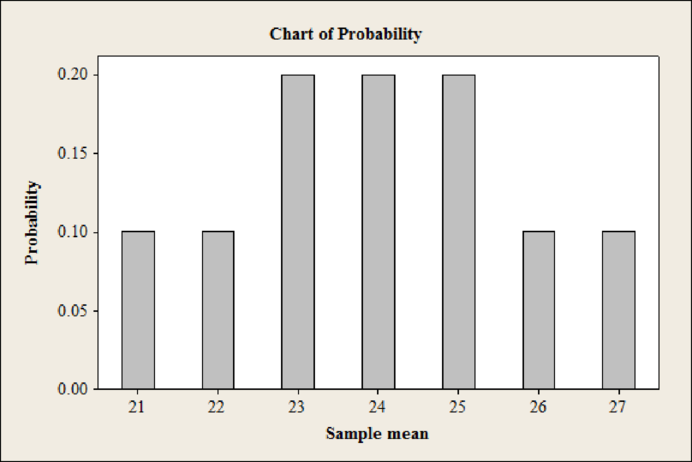
Construct the sampling distribution for the means.
Answer to Problem 3SR
The sampling distribution for the means is
Explanation of Solution
The sampling distribution for the means is as follows:
| Sample mean | Frequency | Probability |
| 21 | 1 | |
| 22 | 1 | |
| 23 | 2 | |
| 24 | 2 | |
| 25 | 2 | |
| 26 | 1 | |
| 27 | 1 | |
Software procedure:
Step-by-step procedure to obtain the bar chart using MINITAB:
- Choose Stat > Graph > Bar chart.
- Under Bars represent, enter select Values from a table.
- Under One column of values select Simple.
- Click on OK.
- Under Graph variables enter probability and under categorical variable enter sample mean.
- Click OK.
Output using MINITAB software is given below:

d.
Give the comparison between the population mean and the mean of the sample means.
Answer to Problem 3SR
The mean of the distribution of the sample means is equal to the population mean.
Explanation of Solution
Population mean is calculated as follows:
The mean of the sample means is calculated as follows:
Comparison:
The mean of the distribution of the sample mean is 24 and the population mean is 24. The two means are exactly same.
Thus, the mean of the distribution of the sample means is equal to the population mean.
e.
Give the dispersion in the population with that in the distribution of the sample mean.
Answer to Problem 3SR
The dispersion in the population is greater than with that of the sample mean.
Explanation of Solution
The population values are 20, 22, 26, 24 and 28. From the part b, the mean of each sample is 21, 23, 22, 24, 24, 23, 25, 25, 27 and 26.
The population values are between 20 and 28. The sample mean values are between 21 and 27.
Thus, the dispersion in the population is greater than with that of the sample mean.
f.
Check whether the distribution of population values is normally distributed or not.
Answer to Problem 3SR
The distribution of population values is not normally distributed.
Explanation of Solution
From the given chart, the frequency of all the years of service is at same level. Then, the distribution of the population values is uniform.
Thus, the distribution of population values is not normally distributed.
g.
Check whether the distribution of the sample mean computed in part (c) starting to show some tendency toward being bell-shaped or not.
Answer to Problem 3SR
The distribution of the sample mean computed in part (c) starting to show some tendency toward being bell-shaped.
Explanation of Solution
From the part (c), it can be observed that the shape of the bar chart is bell shaped.
Thus, the distribution of the sample mean computed in part (c) starting to show some tendency toward being bell-shaped.
Want to see more full solutions like this?
Chapter 8 Solutions
Gen Combo Ll Statistical Techniques In Business And Economics; Connect Ac


- solve the question based on hw 1, 1.41arrow_forwardT1.4: Let ẞ(G) be the minimum size of a vertex cover, a(G) be the maximum size of an independent set and m(G) = |E(G)|. (i) Prove that if G is triangle free (no induced K3) then m(G) ≤ a(G)B(G). Hints - The neighborhood of a vertex in a triangle free graph must be independent; all edges have at least one end in a vertex cover. (ii) Show that all graphs of order n ≥ 3 and size m> [n2/4] contain a triangle. Hints - you may need to use either elementary calculus or the arithmetic-geometric mean inequality.arrow_forwardWe consider the one-period model studied in class as an example. Namely, we assumethat the current stock price is S0 = 10. At time T, the stock has either moved up toSt = 12 (with probability p = 0.6) or down towards St = 8 (with probability 1−p = 0.4).We consider a call option on this stock with maturity T and strike price K = 10. Theinterest rate on the money market is zero.As in class, we assume that you, as a customer, are willing to buy the call option on100 shares of stock for $120. The investor, who sold you the option, can adopt one of thefollowing strategies: Strategy 1: (seen in class) Buy 50 shares of stock and borrow $380. Strategy 2: Buy 55 shares of stock and borrow $430. Strategy 3: Buy 60 shares of stock and borrow $480. Strategy 4: Buy 40 shares of stock and borrow $280.(a) For each of strategies 2-4, describe the value of the investor’s portfolio at time 0,and at time T for each possible movement of the stock.(b) For each of strategies 2-4, does the investor have…arrow_forward
- Negate the following compound statement using De Morgans's laws.arrow_forwardNegate the following compound statement using De Morgans's laws.arrow_forwardQuestion 6: Negate the following compound statements, using De Morgan's laws. A) If Alberta was under water entirely then there should be no fossil of mammals.arrow_forward
- Negate the following compound statement using De Morgans's laws.arrow_forwardCharacterize (with proof) all connected graphs that contain no even cycles in terms oftheir blocks.arrow_forwardLet G be a connected graph that does not have P4 or C3 as an induced subgraph (i.e.,G is P4, C3 free). Prove that G is a complete bipartite grapharrow_forward
 Glencoe Algebra 1, Student Edition, 9780079039897...AlgebraISBN:9780079039897Author:CarterPublisher:McGraw Hill
 Big Ideas Math A Bridge To Success Algebra 1: Stu...AlgebraISBN:9781680331141Author:HOUGHTON MIFFLIN HARCOURTPublisher:Houghton Mifflin Harcourt
 Functions and Change: A Modeling Approach to Coll...AlgebraISBN:9781337111348Author:Bruce Crauder, Benny Evans, Alan NoellPublisher:Cengage Learning