
Elementary Technical Mathematics
11th Edition
ISBN: 9781285199191
Author: Dale Ewen, C. Robert Nelson
Publisher: Cengage Learning
expand_more
expand_more
format_list_bulleted
Videos
Question
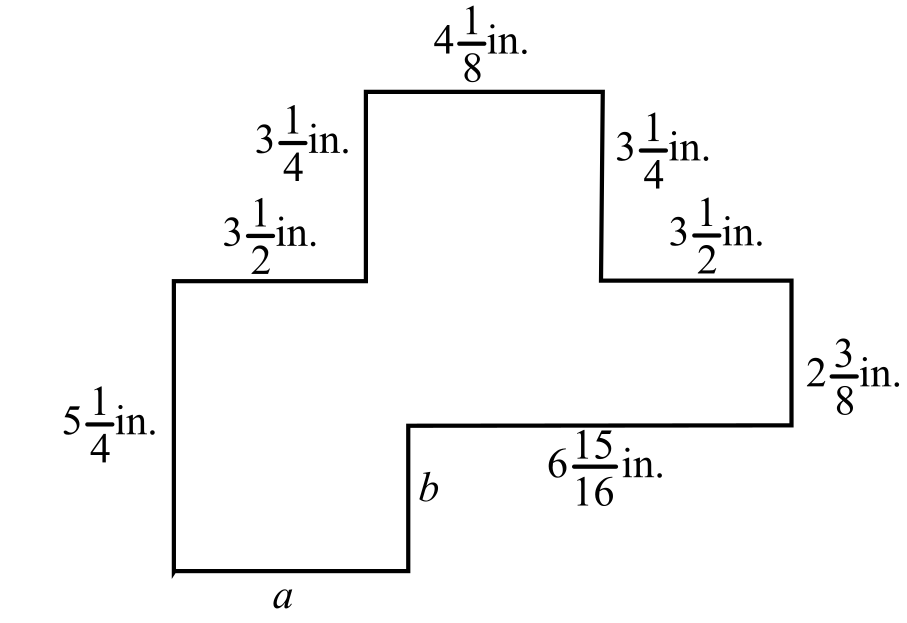
Chapter 8, Problem 3CR
To determine
To calculate: The value of missing dimensions a and b in the given diagram,
Expert Solution & Answer

Trending nowThis is a popular solution!

Students have asked these similar questions
Please conduct a step by step of these statistical tests on separate sheets of Microsoft Excel. If the calculations in Microsoft Excel are incorrect, the null and alternative hypotheses, as well as the conclusions drawn from them, will be meaningless and will not receive any points.
4. One-Way ANOVA: Analyze the customer satisfaction scores across four different product categories to determine if there is a significant difference in means.
(Hints: The null can be about maintaining status-quo or no difference among groups)
H0 =
H1=
Please conduct a step by step of these statistical tests on separate sheets of Microsoft Excel. If the calculations in Microsoft Excel are incorrect, the null and alternative hypotheses, as well as the conclusions drawn from them, will be meaningless and will not receive any points
2. Two-Sample T-Test: Compare the average sales revenue of two different regions to determine if there is a significant difference.
(Hints: The null can be about maintaining status-quo or no difference among groups; if alternative hypothesis is non-directional use the two-tailed p-value from excel file to make a decision about rejecting or not rejecting null)
H0 =
H1=
Please conduct a step by step of these statistical tests on separate sheets of Microsoft Excel. If the calculations in Microsoft Excel are incorrect, the null and alternative hypotheses, as well as the conclusions drawn from them, will be meaningless and will not receive any points
3. Paired T-Test: A company implemented a training program to improve employee performance. To evaluate the effectiveness of the program, the company recorded the test scores of 25 employees before and after the training. Determine if the training program is effective in terms of scores of participants before and after the training.
(Hints: The null can be about maintaining status-quo or no difference among groups; if alternative hypothesis is non-directional, use the two-tailed p-value from excel file to make a decision about rejecting or not rejecting the null)
H0 =
H1=
Conclusion:
Chapter 8 Solutions
Elementary Technical Mathematics
Ch. 8.1 - Complete the three ordered-pair solutions of each...Ch. 8.1 - Complete the three ordered-pair solutions of each...Ch. 8.1 - Complete the three ordered-pair solutions of each...Ch. 8.1 - Prob. 4ECh. 8.1 - Prob. 5ECh. 8.1 - Complete the three ordered-pair solutions of each...Ch. 8.1 - Prob. 7ECh. 8.1 - Prob. 8ECh. 8.1 - Prob. 9ECh. 8.1 - Prob. 10E
Ch. 8.1 - Complete the three ordered-pair solutions of each...Ch. 8.1 - Prob. 12ECh. 8.1 - Prob. 13ECh. 8.1 - Prob. 14ECh. 8.1 - Complete the three ordered-pair solutions of each...Ch. 8.1 - Complete the three ordered-pair solutions of each...Ch. 8.1 - Prob. 17ECh. 8.1 - Prob. 18ECh. 8.1 - Complete the three ordered-pair solutions of each...Ch. 8.1 - Prob. 20ECh. 8.1 - Prob. 21ECh. 8.1 - Prob. 22ECh. 8.1 - Prob. 23ECh. 8.1 - Prob. 24ECh. 8.1 - Prob. 25ECh. 8.1 - Solve for y in terms of x: 4x+5y=10Ch. 8.1 - Prob. 27ECh. 8.1 - Solve for y in terms of x: 2x+2y=5Ch. 8.1 - Prob. 29ECh. 8.1 - Prob. 30ECh. 8.1 - Prob. 31ECh. 8.1 - Prob. 32ECh. 8.1 - Prob. 33ECh. 8.1 - Prob. 34ECh. 8.1 - Prob. 35ECh. 8.1 - Prob. 36ECh. 8.1 - Prob. 37ECh. 8.1 - Write the ordered pair corresponding to each point...Ch. 8.1 - Prob. 39ECh. 8.1 - Prob. 40ECh. 8.1 - Prob. 41ECh. 8.1 - Prob. 42ECh. 8.1 - Prob. 43ECh. 8.1 - Prob. 44ECh. 8.1 - Prob. 45ECh. 8.1 - Write the ordered pair corresponding to each point...Ch. 8.1 - Prob. 47ECh. 8.1 - Prob. 48ECh. 8.1 - Prob. 49ECh. 8.1 - Prob. 50ECh. 8.1 - Prob. 51ECh. 8.1 - Prob. 52ECh. 8.1 - Prob. 53ECh. 8.1 - Plot each point in the number plane. Label each...Ch. 8.1 - Plot each point in the number plane. Label each...Ch. 8.1 - Plot each point in the number plane. Label each...Ch. 8.1 - Plot each point in the number plane. Label each...Ch. 8.1 - Plot each point in the number plane. Label each...Ch. 8.1 - Plot each point in the number plane. Label each...Ch. 8.1 - Plot each point in the number plane. Label each...Ch. 8.1 - Plot each point in the number plane. Label each...Ch. 8.1 - Plot each point in the number plane. Label each...Ch. 8.1 - Prob. 63ECh. 8.1 - Prob. 64ECh. 8.1 - Prob. 65ECh. 8.1 - Prob. 66ECh. 8.2 - Draw the graph of each equation: x+y=7Ch. 8.2 - Prob. 2ECh. 8.2 - Prob. 3ECh. 8.2 - Prob. 4ECh. 8.2 - Prob. 5ECh. 8.2 - Prob. 6ECh. 8.2 - Prob. 7ECh. 8.2 - Draw the graph of each equation: 2x+3y=9Ch. 8.2 - Prob. 9ECh. 8.2 - Prob. 10ECh. 8.2 - Draw the graph of each equation: 5x+4y=20Ch. 8.2 - Prob. 12ECh. 8.2 - Prob. 13ECh. 8.2 - Prob. 14ECh. 8.2 - Prob. 15ECh. 8.2 - Prob. 16ECh. 8.2 - Draw the graph of each equation: 3x+5y=11Ch. 8.2 - Prob. 18ECh. 8.2 - Prob. 19ECh. 8.2 - Prob. 20ECh. 8.2 - Draw the graph of each equation: y=3Ch. 8.2 - Prob. 22ECh. 8.2 - Prob. 23ECh. 8.2 - Prob. 24ECh. 8.2 - Prob. 25ECh. 8.2 - Prob. 26ECh. 8.2 - Prob. 27ECh. 8.2 - Prob. 28ECh. 8.2 - Prob. 29ECh. 8.2 - Prob. 30ECh. 8.2 - Identify the independent and dependent variables...Ch. 8.2 - Prob. 32ECh. 8.2 - Prob. 33ECh. 8.2 - Prob. 34ECh. 8.2 - Prob. 35ECh. 8.2 - Prob. 36ECh. 8.2 - Prob. 37ECh. 8.2 - Prob. 38ECh. 8.2 - Prob. 39ECh. 8.2 - Identify the independent and dependent variables...Ch. 8.2 - Prob. 41ECh. 8.2 - The voltage, v (in mV), in an electrical circuit...Ch. 8.2 - The resistance, R, in an electrical circuit varies...Ch. 8.2 - Prob. 44ECh. 8.2 - The voltage, v, in an electrical circuit is given...Ch. 8.2 - Prob. 46ECh. 8.3 - Find the slope of the passing through each pair of...Ch. 8.3 - Prob. 2ECh. 8.3 - Prob. 3ECh. 8.3 - Prob. 4ECh. 8.3 - Prob. 5ECh. 8.3 - Find the slope of the passing through each pair of...Ch. 8.3 - Prob. 7ECh. 8.3 - Prob. 8ECh. 8.3 - Prob. 9ECh. 8.3 - Prob. 10ECh. 8.3 - Prob. 11ECh. 8.3 - Prob. 12ECh. 8.3 - Prob. 13ECh. 8.3 - Prob. 14ECh. 8.3 - Prob. 15ECh. 8.3 - Prob. 16ECh. 8.3 - Prob. 17ECh. 8.3 - Prob. 18ECh. 8.3 - Find the slope of each line: y=6x+2Ch. 8.3 - Prob. 20ECh. 8.3 - Find the slope of each line: y=5x7Ch. 8.3 - Prob. 22ECh. 8.3 - Prob. 23ECh. 8.3 - Prob. 24ECh. 8.3 - Prob. 25ECh. 8.3 - Prob. 26ECh. 8.3 - Prob. 27ECh. 8.3 - Prob. 28ECh. 8.3 - Prob. 29ECh. 8.3 - Prob. 30ECh. 8.3 - Determine whether the lines given by the equations...Ch. 8.3 - Determine whether the lines given by the equations...Ch. 8.3 - Prob. 33ECh. 8.3 - Prob. 34ECh. 8.3 - Prob. 35ECh. 8.3 - Prob. 36ECh. 8.3 - Determine whether the lines given by the equations...Ch. 8.3 - Determine whether the lines given by the equations...Ch. 8.3 - Determine whether the lines given by the equations...Ch. 8.3 - Determine whether the lines given by the equations...Ch. 8.4 - Draw the graph of each line with the given slope...Ch. 8.4 - Draw the graph of each line with the given slope...Ch. 8.4 - Prob. 3ECh. 8.4 - Prob. 4ECh. 8.4 - Prob. 5ECh. 8.4 - Prob. 6ECh. 8.4 - Prob. 7ECh. 8.4 - Prob. 8ECh. 8.4 - Prob. 9ECh. 8.4 - Prob. 10ECh. 8.4 - Prob. 11ECh. 8.4 - Prob. 12ECh. 8.4 - Prob. 13ECh. 8.4 - Prob. 14ECh. 8.4 - Prob. 15ECh. 8.4 - Prob. 16ECh. 8.4 - Prob. 17ECh. 8.4 - Draw the graph of each equation using the slope...Ch. 8.4 - Prob. 19ECh. 8.4 - Draw the graph of each equation using the slope...Ch. 8.4 - Prob. 21ECh. 8.4 - Prob. 22ECh. 8.4 - Prob. 23ECh. 8.4 - Prob. 24ECh. 8.4 - Prob. 25ECh. 8.4 - Find the equation of the line with given slope and...Ch. 8.4 - Prob. 27ECh. 8.4 - Find the equation of the line with given slope and...Ch. 8.4 - Prob. 29ECh. 8.4 - Prob. 30ECh. 8.4 - Prob. 31ECh. 8.4 - Prob. 32ECh. 8.4 - Prob. 33ECh. 8.4 - Prob. 34ECh. 8.4 - Prob. 35ECh. 8.4 - Prob. 36ECh. 8.4 - Prob. 37ECh. 8.4 - Draw the graph of the line through the given point...Ch. 8.4 - Draw the graph of the line through the given point...Ch. 8.4 - Prob. 40ECh. 8.4 - Prob. 41ECh. 8.4 - Prob. 42ECh. 8.4 - Prob. 43ECh. 8.4 - Prob. 44ECh. 8.4 - Find the equation of the line through the given...Ch. 8.4 - Find the equation of the line through the given...Ch. 8.4 - Prob. 47ECh. 8.4 - Prob. 48ECh. 8.4 - Prob. 49ECh. 8.4 - Prob. 50ECh. 8.4 - Prob. 51ECh. 8.4 - Prob. 52ECh. 8.4 - Prob. 53ECh. 8.4 - Prob. 54ECh. 8.4 - Prob. 55ECh. 8.4 - Prob. 56ECh. 8.4 - Prob. 57ECh. 8.4 - Find the equation of the line through the given...Ch. 8.4 - Find the equation of the line through the given...Ch. 8.4 - Prob. 60ECh. 8 - Prob. 1RCh. 8 - Complete the ordered-pair solution of each...Ch. 8 - Solve for y: 6x+y=15.Ch. 8 - Solve For y:3x5y=10.Ch. 8 - Write the ordered pair corresponding to each point...Ch. 8 - Write the ordered pair corresponding to each point...Ch. 8 - Write the ordered pair corresponding to each point...Ch. 8 - Write the ordered pair corresponding to each point...Ch. 8 - Plot each point in the number plane. Label each...Ch. 8 - Prob. 10RCh. 8 - Prob. 11RCh. 8 - Prob. 12RCh. 8 - Draw the graph of each equation: x+y=8Ch. 8 - Prob. 14RCh. 8 - Draw the graph of each equation: 3x+6y=12Ch. 8 - Draw the graph of each equation: 4x5y=15Ch. 8 - Prob. 17RCh. 8 - Prob. 18RCh. 8 - Draw the graph of each equation: x=6Ch. 8 - Draw the graph of each equation: y=7Ch. 8 - Find the slope of the line passing through each...Ch. 8 - Find the slope of the line passing through each...Ch. 8 - Prob. 23RCh. 8 - Prob. 24RCh. 8 - Prob. 25RCh. 8 - Prob. 26RCh. 8 - Prob. 27RCh. 8 - Prob. 28RCh. 8 - Prob. 29RCh. 8 - Prob. 30RCh. 8 - Prob. 31RCh. 8 - Prob. 32RCh. 8 - Prob. 33RCh. 8 - Prob. 34RCh. 8 - Prob. 35RCh. 8 - Prob. 36RCh. 8 - Prob. 37RCh. 8 - Prob. 38RCh. 8 - Find the equation of the line through the given...Ch. 8 - Find the equation of the line through the given...Ch. 8 - Prob. 41RCh. 8 - Find the equation of the line through the given...Ch. 8 - Given the equation 3x4y=24, complete each ordered...Ch. 8 - Given the equation 3x4y=24, complete each ordered...Ch. 8 - Prob. 3TCh. 8 - Write the ordered pair corresponding to each point...Ch. 8 - Prob. 5TCh. 8 - Prob. 6TCh. 8 - Prob. 7TCh. 8 - Prob. 8TCh. 8 - Prob. 9TCh. 8 - Find the slope of each line: y=3x2Ch. 8 - Prob. 11TCh. 8 - Prob. 12TCh. 8 - Prob. 13TCh. 8 - Prob. 14TCh. 8 - Prob. 15TCh. 8 - Draw the graph of the line y=12x+4, using its...Ch. 8 - Prob. 1CRCh. 8 - Prob. 2CRCh. 8 - Prob. 3CRCh. 8 - Prob. 4CRCh. 8 - Prob. 5CRCh. 8 - Prob. 6CRCh. 8 - Prob. 7CRCh. 8 - Read the measurement shown on the metric...Ch. 8 - Prob. 9CRCh. 8 - Prob. 10CRCh. 8 - Prob. 11CRCh. 8 - Prob. 12CRCh. 8 - Prob. 13CRCh. 8 - Solve: 2x3+15=x423Ch. 8 - Prob. 15CRCh. 8 - Prob. 16CRCh. 8 - Prob. 17CRCh. 8 - Prob. 18CRCh. 8 - Prob. 19CRCh. 8 - Prob. 20CRCh. 8 - Prob. 21CRCh. 8 - Prob. 22CRCh. 8 - Prob. 23CRCh. 8 - Prob. 24CRCh. 8 - Prob. 25CRCh. 8 - Prob. 26CRCh. 8 - Prob. 27CRCh. 8 - Prob. 28CRCh. 8 - Prob. 29CRCh. 8 - Determine whether the graphs of 2x3y=6 and 3x+5y=7...
Knowledge Booster


Learn more about
Need a deep-dive on the concept behind this application? Look no further. Learn more about this topic, subject and related others by exploring similar questions and additional content below.Similar questions
- please question 9arrow_forwardPlease conduct a step by step of these statistical tests on separate sheets of Microsoft Excel. If the calculations in Microsoft Excel are incorrect, the null and alternative hypotheses, as well as the conclusions drawn from them, will be meaningless and will not receive any points. The data for the following questions is provided in Microsoft Excel file on 4 separate sheets. Please conduct these statistical tests on separate sheets of Microsoft Excel. If the calculations in Microsoft Excel are incorrect, the null and alternative hypotheses, as well as the conclusions drawn from them, will be meaningless and will not receive any points. 1. One Sample T-Test: Determine whether the average satisfaction rating of customers for a product is significantly different from a hypothetical mean of 75. (Hints: The null can be about maintaining status-quo or no difference; If your alternative hypothesis is non-directional (e.g., μ≠75), you should use the two-tailed p-value from excel file to…arrow_forwardPlease conduct a step by step of these statistical tests on separate sheets of Microsoft Excel. If the calculations in Microsoft Excel are incorrect, the null and alternative hypotheses, as well as the conclusions drawn from them, will be meaningless and will not receive any points. The data for the following questions is provided in Microsoft Excel file on 4 separate sheets. Please conduct these statistical tests on separate sheets of Microsoft Excel. If the calculations in Microsoft Excel are incorrect, the null and alternative hypotheses, as well as the conclusions drawn from them, will be meaningless and will not receive any points. 1. One Sample T-Test: Determine whether the average satisfaction rating of customers for a product is significantly different from a hypothetical mean of 75. (Hints: The null can be about maintaining status-quo or no difference; If your alternative hypothesis is non-directional (e.g., μ≠75), you should use the two-tailed p-value from excel file to…arrow_forward
- Use the definite integral to find the area between the x-axis and f(x) over the indicated interval. Check first to see if the graph crosses the x-axis in the given interval. 3. f(x) = 4x; [-5,3]arrow_forwardUse the definite integral to find the area between the x-axis and f(x) over the indicated interval. Check first to see if the graph crosses the x-axis in the given interval. f(x)=3e-4; [3,3]arrow_forwardA small company of science writers found that its rate of profit (in thousands of dollars) after t years of operation is given by P'(t) = (7t + 14) (t² + 4t+7) * (a) Find the total profit in the first four years. (b) Find the profit in the sixth year of operation. (c) What is happening to the annual profit over the long run?arrow_forward
- Please conduct a step by step of these statistical tests on separate sheets of Microsoft Excel. If the calculations in Microsoft Excel are incorrect, the null and alternative hypotheses, as well as the conclusions drawn from them, will be meaningless and will not receive any points. 1. One Sample T-Test: Determine whether the average satisfaction rating of customers for a product is significantly different from a hypothetical mean of 75. (Hints: The null can be about maintaining status-quo or no difference; If your alternative hypothesis is non-directional (e.g., μ≠75), you should use the two-tailed p-value from excel file to make a decision about rejecting or not rejecting null. If alternative is directional (e.g., μ < 75), you should use the lower-tailed p-value. For alternative hypothesis μ > 75, you should use the upper-tailed p-value.) H0 = H1= Conclusion: The p value from one sample t-test is _______. Since the two-tailed p-value is _______ 2. Two-Sample T-Test:…arrow_forwardPlease conduct a step by step of these statistical tests on separate sheets of Microsoft Excel. If the calculations in Microsoft Excel are incorrect, the null and alternative hypotheses, as well as the conclusions drawn from them, will be meaningless and will not receive any points. What is one sample T-test? Give an example of business application of this test? What is Two-Sample T-Test. Give an example of business application of this test? .What is paired T-test. Give an example of business application of this test? What is one way ANOVA test. Give an example of business application of this test? 1. One Sample T-Test: Determine whether the average satisfaction rating of customers for a product is significantly different from a hypothetical mean of 75. (Hints: The null can be about maintaining status-quo or no difference; If your alternative hypothesis is non-directional (e.g., μ≠75), you should use the two-tailed p-value from excel file to make a decision about rejecting or not…arrow_forwardA professor gives two types of quizzes, objective and recall. He plans to give at least 15 quizzes this quarter. The student preparation time for an objective quiz is 15 minutes and for a recall quiz 30 minutes. The professor would like a student to spend at least 5 hours total (300 minutes) preparing for these quizzes. It takes the professor 1 minute to grade an objective quiz, and 1.5 minutes to grade a recall type quiz. How many of each type of quiz should the professor give in order to minimize his grading time (why still meeting the other requirements outlined)?arrow_forward
- The data for the following questions is provided in Microsoft Excel file on 4 separate sheets. Please conduct a step by step of these statistical tests on separate sheets of Microsoft Excel. If the calculations in Microsoft Excel are incorrect, the null and alternative hypotheses, as well as the conclusions drawn from them, will be meaningless and will not receive any points. What is one sample T-test? Give an example of business application of this test? What is Two-Sample T-Test. Give an example of business application of this test? .What is paired T-test. Give an example of business application of this test? What is one way ANOVA test. Give an example of business application of this test? 1. One Sample T-Test: Determine whether the average satisfaction rating of customers for a product is significantly different from a hypothetical mean of 75. (Hints: The null can be about maintaining status-quo or no difference; If your alternative hypothesis is non-directional (e.g., μ≠75), you…arrow_forwardExplain how the answer could be 2 or 1.8 WITHOUT changing the questionarrow_forwardCalculus III May I have an expert explained how the terms were simplified into 6(3-x)^2? Thank you,arrow_forward
arrow_back_ios
SEE MORE QUESTIONS
arrow_forward_ios
Recommended textbooks for you
 Algebra & Trigonometry with Analytic GeometryAlgebraISBN:9781133382119Author:SwokowskiPublisher:Cengage
 Mathematics For Machine TechnologyAdvanced MathISBN:9781337798310Author:Peterson, John.Publisher:Cengage Learning,
 Trigonometry (MindTap Course List)TrigonometryISBN:9781305652224Author:Charles P. McKeague, Mark D. TurnerPublisher:Cengage Learning
 Glencoe Algebra 1, Student Edition, 9780079039897...AlgebraISBN:9780079039897Author:CarterPublisher:McGraw Hill
 Algebra: Structure And Method, Book 1AlgebraISBN:9780395977224Author:Richard G. Brown, Mary P. Dolciani, Robert H. Sorgenfrey, William L. ColePublisher:McDougal Littell
Algebra & Trigonometry with Analytic Geometry
Algebra
ISBN:9781133382119
Author:Swokowski
Publisher:Cengage
Mathematics For Machine Technology
Advanced Math
ISBN:9781337798310
Author:Peterson, John.
Publisher:Cengage Learning,
Trigonometry (MindTap Course List)
Trigonometry
ISBN:9781305652224
Author:Charles P. McKeague, Mark D. Turner
Publisher:Cengage Learning
Glencoe Algebra 1, Student Edition, 9780079039897...
Algebra
ISBN:9780079039897
Author:Carter
Publisher:McGraw Hill
Algebra: Structure And Method, Book 1
Algebra
ISBN:9780395977224
Author:Richard G. Brown, Mary P. Dolciani, Robert H. Sorgenfrey, William L. Cole
Publisher:McDougal Littell
What is a Prism? | Types of Prism | Don't Memorise; Author: Don't Memorise;https://www.youtube.com/watch?v=wxDTrgnyu28;License: Standard YouTube License, CC-BY