
Introductory Statistics Plus Mylab Statistics With Pearson Etext -- Access Card Package (3rd Edition)
3rd Edition
ISBN: 9780135229996
Author: Robert Gould, Rebecca Wong, Colleen N. Ryan
Publisher: PEARSON
expand_more
expand_more
format_list_bulleted
Videos
Textbook Question
Chapter 8, Problem 33SE
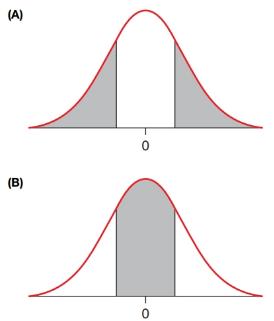
p-Values For each graph, indicate whether the shaded area could represent a p-value. Explain why or why not. If yes, state whether the area could represent the p-value for a one-sided or a two-sided alternative hypothesis.
Expert Solution & Answer
Want to see the full answer?
Check out a sample textbook solution
Students have asked these similar questions
Suppose an experiment was conducted to compare the mileage(km) per litre
obtained by competing brands of petrol I,II,III. Three new Mazda, three new
Toyota and three new Nissan cars were available for experimentation. During the
experiment the cars would operate under same conditions in order to eliminate
the effect of external variables on the distance travelled per litre on the assigned
brand of petrol. The data is given as below:
Brands of Petrol Mazda Toyota Nissan
I 10.6 12.0 11.0
II 9.0 15.0 12.0
III 12.0 17.4 13.0
(a) Test at the 5% level of significance whether there are signi
cant differences among the brands of fuels and also among the cars. [10]
(b) Compute the standard error for comparing any two fuel brands means. Hence
compare, at the 5% level of significance, each of fuel brands II, and III with
the standard fuel brand I. [10] �
Business discuss
What would you say about a set of quantitative bivariate data whose linear correlation is -1? What would a scatter diagram of the data look like? (5 points)
Chapter 8 Solutions
Introductory Statistics Plus Mylab Statistics With Pearson Etext -- Access Card Package (3rd Edition)
Ch. 8 - Choose one of the answers given. The null...Ch. 8 - Choose one of the answers in each case. In...Ch. 8 - Vegetarians (Example 1) In 2016 a Harris poll...Ch. 8 - Embedded Tutors A college chemistry instructor...Ch. 8 - Teen Drivers According to a 2015 University of...Ch. 8 - Water A friend is tested to see whether he can...Ch. 8 - Prob. 7SECh. 8 - Law School Grad Employment The National...Ch. 8 - Soda Orders (Example 2) A manager at a casual...Ch. 8 - Mixed Nuts The label on a can of mixed nuts says...
Ch. 8 - Flu Vaccine (Example 3) An immunologist is testing...Ch. 8 - Law School Grad Employment An economist is testing...Ch. 8 - Prob. 13SECh. 8 - Hybrid Car Sales According to Green Car Reports,...Ch. 8 - Vegetarians (Example 4) In 2016 the Harris poll...Ch. 8 - Embedded Tutors A college chemistry instructor...Ch. 8 - Coke versus Pepsi (Example 5) Suppose you are...Ch. 8 - St. Louis Jury Pool St. Louis County is 24 African...Ch. 8 - Vegetarians (Example 6) In problem 8.15 the...Ch. 8 - Embedded Tutors In problem 8.16, a college...Ch. 8 - Hospital Readmission A hospital readmission is an...Ch. 8 - Guessing A 20-question multiple choice quiz has...Ch. 8 - Dreaming (Example 7) A 2003 study of dreaming...Ch. 8 - Age Discrimination About 30 of the population in...Ch. 8 - Self-Driving Cars (Example 8) In a Northeastern...Ch. 8 - Diabetes According to a Gallup poll, 11.55 of...Ch. 8 - Coke versus Pepsi A taste test is done to see...Ch. 8 - Seat Belts Suppose we are testing people to see...Ch. 8 - Working Out (Example 9) According to a 2018 survey...Ch. 8 - Vacations According to a 2017 AAA survey, 35 of...Ch. 8 - Working Out (Example 10) According to a 2018...Ch. 8 - Vacations According to a 2017 AAA survey, 35 of...Ch. 8 - p-Values For each graph, indicate whether the...Ch. 8 - p-Values For each graph, state whether the shaded...Ch. 8 - News on Facebook A 2018 Gallup poll of 3635...Ch. 8 - Olympic Viewing A 2018 Gallup poll of 2228...Ch. 8 - Global Warming Historically (from about 2001 to...Ch. 8 - Plane Crashes According to one source, 50 of plane...Ch. 8 - Mercury in Freshwater Fish Some experts believe...Ch. 8 - Twitter Suppose a poll is taken that shows 220 out...Ch. 8 - Morse’s Proportion of ts Samuel Morse determined...Ch. 8 - Morse’s Proportion of as Samuel Morse determined...Ch. 8 - p-Values (Example 11) A researcher carried out a...Ch. 8 - Coin Flips A test is conducted in which a coin is...Ch. 8 - Young Voters (Example 12) According to the...Ch. 8 - Errors with Toast Suppose you are testing someone...Ch. 8 - Blackstone on Errors in Trials Sir William...Ch. 8 - Alpha By establishing a small value for the...Ch. 8 - Superpower (Example 13) What superpower do...Ch. 8 - Flaws The null hypothesis on true/false tests is...Ch. 8 - Which Method? A proponent of a new proposition on...Ch. 8 - Which Method? A proponent of a new proposition on...Ch. 8 - Effectiveness of Financial Incentives A...Ch. 8 - Is it acceptable practice to look at your research...Ch. 8 - If we reject the null hypothesis, can we claim to...Ch. 8 - If we do not reject the null hypothesis, is it...Ch. 8 - When a person stands trial for murder, the jury is...Ch. 8 - When, in a criminal court, a defendant is found...Ch. 8 - Arthritis A magazine advertisement claims that...Ch. 8 - No-Carb Diet A weight-loss diet claims that it...Ch. 8 - When comparing two sample proportions with a...Ch. 8 - When comparing two sample proportions with a...Ch. 8 - Treatment for HIV-1 In a 2018 study reported in...Ch. 8 - Smoking Cessation in HIV Patients In a 2018 study...Ch. 8 - Reading (Example 14) The researchers in a Pew...Ch. 8 - Audio Books Pew Research published survey results...Ch. 8 - Freedom of the Press A Gallup poll asked college...Ch. 8 - Freedom of Religion A Gallup poll asked college...Ch. 8 - Environmental Quality (Example 15) A Gallup poll...Ch. 8 - Caregiving Responsibilities In 2017 the Pew...Ch. 8 - Prob. 71CRECh. 8 - Choosing a Test and Naming the Population(s) For...Ch. 8 - Choosing a Test and Giving the Hypotheses Give the...Ch. 8 - Choosing a Test and Naming the Population(s) In...Ch. 8 - Water Taste Test A student who claims that he can...Ch. 8 - Butter Taste Test A student is tested to determine...Ch. 8 - Biased Coin? A study is done to see whether a coin...Ch. 8 - Biased Coin? A study is done to see whether a coin...Ch. 8 - ESP A researcher studying extrasensory perception...Ch. 8 - Coin Flips Suppose you tested 50 coins by flipping...Ch. 8 - Student Age A community college used enrollment...Ch. 8 - Taste Test A student was tested to see if he could...Ch. 8 - Facebook Pew Research conducts polls on social...Ch. 8 - Television In the Pew Research social media...Ch. 8 - Presidential Election Pew Research reported that...Ch. 8 - Educational Attainment According to a 2016 report...Ch. 8 - Self-Employment According to the Bureau of Labor...Ch. 8 - Student Loans According to a 2016 report from the...Ch. 8 - Gun Control A Quinnipiac poll conducted on...Ch. 8 - Gay Marriage A Gallup poll conducted in 2017 found...Ch. 8 - Three-Strikes Law California’s controversial...Ch. 8 - Prob. 92CRECh. 8 - Prob. 93CRECh. 8 - Cloning Dolly the Sheep, the world’s first mammal...Ch. 8 - A friend claims he can predict the suit of a card...Ch. 8 - A friend claims he can predict how a six-sided die...Ch. 8 - Votes for Independents Judging on the basis of...Ch. 8 - Votes for Independents Refer to Exercise 8.97....Ch. 8 - Texting While Driving The mother of a teenager has...Ch. 8 - True/False Test A teacher giving a true/false test...Ch. 8 - ESP Suppose a friend says he can predict whether a...Ch. 8 - ESP Again Suppose a friend says he can predict...Ch. 8 - Does Hand Washing Save Lives? In the mid-1800s,...Ch. 8 - Opioid Crisis Suppose you wanted to test the claim...Ch. 8 - Guessing on a True/False Test A true/false test...Ch. 8 - Guessing on a Multiple-Choice Test A...
Additional Math Textbook Solutions
Find more solutions based on key concepts
(a) Make a stem-and-leaf plot for these 24 observations on the number of customers who used a down-town CitiBan...
APPLIED STAT.IN BUS.+ECONOMICS
For each hour of class time, how many hours outside of class are recommended for studying and doing homework?
Elementary Algebra For College Students (10th Edition)
Provide an example of a qualitative variable and an example of a quantitative variable.
Elementary Statistics ( 3rd International Edition ) Isbn:9781260092561
CHECK POINT I Consider the six jokes about books by Groucho Marx. Bob Blitzer. Steven Wright, HennyYoungman. Je...
Thinking Mathematically (6th Edition)
Use the ideas in drawings a and b to find the solution to Gausss Problem for the sum 1+2+3+...+n. Explain your ...
A Problem Solving Approach To Mathematics For Elementary School Teachers (13th Edition)
Fill in each blank so that the resulting statement is true.
1. The degree of the polynomial function is _____....
Algebra and Trigonometry (6th Edition)
Knowledge Booster


Learn more about
Need a deep-dive on the concept behind this application? Look no further. Learn more about this topic, statistics and related others by exploring similar questions and additional content below.Similar questions
- Business discussarrow_forwardAnalyze the residuals of a linear regression model and select the best response. yes, the residual plot does not show a curve no, the residual plot shows a curve yes, the residual plot shows a curve no, the residual plot does not show a curve I answered, "No, the residual plot shows a curve." (and this was incorrect). I am not sure why I keep getting these wrong when the answer seems obvious. Please help me understand what the yes and no references in the answer.arrow_forwarda. Find the value of A.b. Find pX(x) and py(y).c. Find pX|y(x|y) and py|X(y|x)d. Are x and y independent? Why or why not?arrow_forward
- Analyze the residuals of a linear regression model and select the best response.Criteria is simple evaluation of possible indications of an exponential model vs. linear model) no, the residual plot does not show a curve yes, the residual plot does not show a curve yes, the residual plot shows a curve no, the residual plot shows a curve I selected: yes, the residual plot shows a curve and it is INCORRECT. Can u help me understand why?arrow_forwardYou have been hired as an intern to run analyses on the data and report the results back to Sarah; the five questions that Sarah needs you to address are given below. please do it step by step on excel Does there appear to be a positive or negative relationship between price and screen size? Use a scatter plot to examine the relationship. Determine and interpret the correlation coefficient between the two variables. In your interpretation, discuss the direction of the relationship (positive, negative, or zero relationship). Also discuss the strength of the relationship. Estimate the relationship between screen size and price using a simple linear regression model and interpret the estimated coefficients. (In your interpretation, tell the dollar amount by which price will change for each unit of increase in screen size). Include the manufacturer dummy variable (Samsung=1, 0 otherwise) and estimate the relationship between screen size, price and manufacturer dummy as a multiple…arrow_forwardHere is data with as the response variable. x y54.4 19.124.9 99.334.5 9.476.6 0.359.4 4.554.4 0.139.2 56.354 15.773.8 9-156.1 319.2Make a scatter plot of this data. Which point is an outlier? Enter as an ordered pair, e.g., (x,y). (x,y)= Find the regression equation for the data set without the outlier. Enter the equation of the form mx+b rounded to three decimal places. y_wo= Find the regression equation for the data set with the outlier. Enter the equation of the form mx+b rounded to three decimal places. y_w=arrow_forward
- You have been hired as an intern to run analyses on the data and report the results back to Sarah; the five questions that Sarah needs you to address are given below. please do it step by step Does there appear to be a positive or negative relationship between price and screen size? Use a scatter plot to examine the relationship. Determine and interpret the correlation coefficient between the two variables. In your interpretation, discuss the direction of the relationship (positive, negative, or zero relationship). Also discuss the strength of the relationship. Estimate the relationship between screen size and price using a simple linear regression model and interpret the estimated coefficients. (In your interpretation, tell the dollar amount by which price will change for each unit of increase in screen size). Include the manufacturer dummy variable (Samsung=1, 0 otherwise) and estimate the relationship between screen size, price and manufacturer dummy as a multiple linear…arrow_forwardExercises: Find all the whole number solutions of the congruence equation. 1. 3x 8 mod 11 2. 2x+3= 8 mod 12 3. 3x+12= 7 mod 10 4. 4x+6= 5 mod 8 5. 5x+3= 8 mod 12arrow_forwardScenario Sales of products by color follow a peculiar, but predictable, pattern that determines how many units will sell in any given year. This pattern is shown below Product Color 1995 1996 1997 Red 28 42 21 1998 23 1999 29 2000 2001 2002 Unit Sales 2003 2004 15 8 4 2 1 2005 2006 discontinued Green 26 39 20 22 28 14 7 4 2 White 43 65 33 36 45 23 12 Brown 58 87 44 48 60 Yellow 37 56 28 31 Black 28 42 21 Orange 19 29 Purple Total 28 42 21 49 68 78 95 123 176 181 164 127 24 179 Questions A) Which color will sell the most units in 2007? B) Which color will sell the most units combined in the 2007 to 2009 period? Please show all your analysis, leave formulas in cells, and specify any assumptions you make.arrow_forward
- One hundred students were surveyed about their preference between dogs and cats. The following two-way table displays data for the sample of students who responded to the survey. Preference Male Female TOTAL Prefers dogs \[36\] \[20\] \[56\] Prefers cats \[10\] \[26\] \[36\] No preference \[2\] \[6\] \[8\] TOTAL \[48\] \[52\] \[100\] problem 1 Find the probability that a randomly selected student prefers dogs.Enter your answer as a fraction or decimal. \[P\left(\text{prefers dogs}\right)=\] Incorrect Check Hide explanation Preference Male Female TOTAL Prefers dogs \[\blueD{36}\] \[\blueD{20}\] \[\blueE{56}\] Prefers cats \[10\] \[26\] \[36\] No preference \[2\] \[6\] \[8\] TOTAL \[48\] \[52\] \[100\] There were \[\blueE{56}\] students in the sample who preferred dogs out of \[100\] total students.arrow_forwardBusiness discussarrow_forwardYou have been hired as an intern to run analyses on the data and report the results back to Sarah; the five questions that Sarah needs you to address are given below. Does there appear to be a positive or negative relationship between price and screen size? Use a scatter plot to examine the relationship. Determine and interpret the correlation coefficient between the two variables. In your interpretation, discuss the direction of the relationship (positive, negative, or zero relationship). Also discuss the strength of the relationship. Estimate the relationship between screen size and price using a simple linear regression model and interpret the estimated coefficients. (In your interpretation, tell the dollar amount by which price will change for each unit of increase in screen size). Include the manufacturer dummy variable (Samsung=1, 0 otherwise) and estimate the relationship between screen size, price and manufacturer dummy as a multiple linear regression model. Interpret the…arrow_forward
arrow_back_ios
SEE MORE QUESTIONS
arrow_forward_ios
Recommended textbooks for you
 Glencoe Algebra 1, Student Edition, 9780079039897...AlgebraISBN:9780079039897Author:CarterPublisher:McGraw Hill
 Holt Mcdougal Larson Pre-algebra: Student Edition...AlgebraISBN:9780547587776Author:HOLT MCDOUGALPublisher:HOLT MCDOUGAL
 Big Ideas Math A Bridge To Success Algebra 1: Stu...AlgebraISBN:9781680331141Author:HOUGHTON MIFFLIN HARCOURTPublisher:Houghton Mifflin Harcourt
 Algebra: Structure And Method, Book 1AlgebraISBN:9780395977224Author:Richard G. Brown, Mary P. Dolciani, Robert H. Sorgenfrey, William L. ColePublisher:McDougal Littell
Glencoe Algebra 1, Student Edition, 9780079039897...
Algebra
ISBN:9780079039897
Author:Carter
Publisher:McGraw Hill
Holt Mcdougal Larson Pre-algebra: Student Edition...
Algebra
ISBN:9780547587776
Author:HOLT MCDOUGAL
Publisher:HOLT MCDOUGAL
Big Ideas Math A Bridge To Success Algebra 1: Stu...
Algebra
ISBN:9781680331141
Author:HOUGHTON MIFFLIN HARCOURT
Publisher:Houghton Mifflin Harcourt
Algebra: Structure And Method, Book 1
Algebra
ISBN:9780395977224
Author:Richard G. Brown, Mary P. Dolciani, Robert H. Sorgenfrey, William L. Cole
Publisher:McDougal Littell
Hypothesis Testing using Confidence Interval Approach; Author: BUM2413 Applied Statistics UMP;https://www.youtube.com/watch?v=Hq1l3e9pLyY;License: Standard YouTube License, CC-BY
Hypothesis Testing - Difference of Two Means - Student's -Distribution & Normal Distribution; Author: The Organic Chemistry Tutor;https://www.youtube.com/watch?v=UcZwyzwWU7o;License: Standard Youtube License