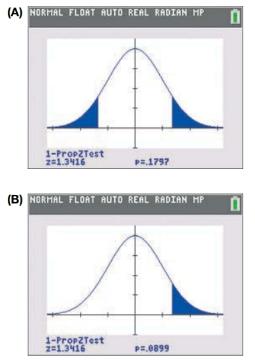
Coke versus Pepsi A taste test is done to see whether a person can tell Coke from Pepsi. In each case, 20 random and independent trials are done (half with Pepsi and half with Coke) in which the person determines whether she or he is drinking Coke or Pepsi. One person gets 13 right out of 20 trials. Which of the following is the correct figure to test the hypothesis that the person can tell the difference? Explain your choice.
Coke versus Pepsi A taste test is done to see whether a person can tell Coke from Pepsi. In each case, 20 random and independent trials are done (half with Pepsi and half with Coke) in which the person determines whether she or he is drinking Coke or Pepsi. One person gets 13 right out of 20 trials. Which of the following is the correct figure to test the hypothesis that the person can tell the difference? Explain your choice.
Solution Summary: The author identifies the correct figure for testing the hypothesis that a person can tell the difference between Coke and Pepsi.
Coke versus Pepsi A taste test is done to see whether a person can tell Coke from Pepsi. In each case, 20 random and independent trials are done (half with Pepsi and half with Coke) in which the person determines whether she or he is drinking Coke or Pepsi. One person gets 13 right out of 20 trials. Which of the following is the correct figure to test the hypothesis that the person can tell the difference? Explain your choice.
NC Current Students - North Ce X | NC Canvas Login Links - North ( X
Final Exam Comprehensive x Cengage Learning
x
WASTAT - Final Exam - STAT
→
C
webassign.net/web/Student/Assignment-Responses/submit?dep=36055360&tags=autosave#question3659890_9
Part (b)
Draw a scatter plot of the ordered pairs.
N
Life
Expectancy
Life
Expectancy
80
70
600
50
40
30
20
10
Year of
1950
1970 1990
2010 Birth
O
Life
Expectancy
Part (c)
800
70
60
50
40
30
20
10
1950
1970 1990
W
ALT
林
$
#
4
R
J7
Year of
2010 Birth
F6
4+
80
70
60
50
40
30
20
10
Year of
1950 1970 1990
2010 Birth
Life
Expectancy
Ox
800
70
60
50
40
30
20
10
Year of
1950 1970 1990 2010 Birth
hp
P.B.
KA
&
7
80
% 5
H
A
B
F10
711
N
M
K
744
PRT SC
ALT
CTRL
Chapter 8 Solutions
Pearson eText Introductory Statistics: Exploring the World Through Data -- Instant Access (Pearson+)
Elementary Statistics: Picturing the World (7th Edition)
Knowledge Booster
Learn more about
Need a deep-dive on the concept behind this application? Look no further. Learn more about this topic, statistics and related others by exploring similar questions and additional content below.
Hypothesis Testing using Confidence Interval Approach; Author: BUM2413 Applied Statistics UMP;https://www.youtube.com/watch?v=Hq1l3e9pLyY;License: Standard YouTube License, CC-BY
Hypothesis Testing - Difference of Two Means - Student's -Distribution & Normal Distribution; Author: The Organic Chemistry Tutor;https://www.youtube.com/watch?v=UcZwyzwWU7o;License: Standard Youtube License


 Holt Mcdougal Larson Pre-algebra: Student Edition...AlgebraISBN:9780547587776Author:HOLT MCDOUGALPublisher:HOLT MCDOUGAL
 Big Ideas Math A Bridge To Success Algebra 1: Stu...AlgebraISBN:9781680331141Author:HOUGHTON MIFFLIN HARCOURTPublisher:Houghton Mifflin Harcourt
 Glencoe Algebra 1, Student Edition, 9780079039897...AlgebraISBN:9780079039897Author:CarterPublisher:McGraw Hill
 College Algebra (MindTap Course List)AlgebraISBN:9781305652231Author:R. David Gustafson, Jeff HughesPublisher:Cengage Learning
 Algebra and Trigonometry (MindTap Course List)AlgebraISBN:9781305071742Author:James Stewart, Lothar Redlin, Saleem WatsonPublisher:Cengage Learning