
Concept explainers
Videos
Spreadsheet Exercise
Jane is considering investing in three different stocks or creating three distinct two-stock portfolios. Jane views herself as a rather conservative investor. She is able to obtain historical returns for the three securities for the years 2012 through 2018. The data are given in the following table.
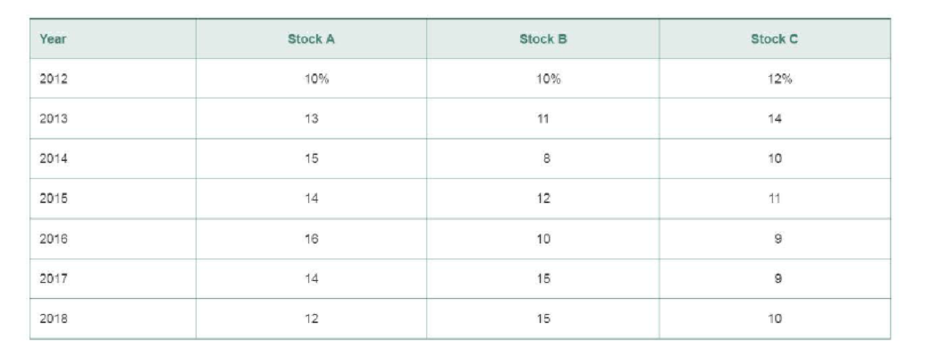
In any of the possible two-stock portfolios, the we1ght of each stock m the portfolio will be 50%. The three possible portfolio combinations are AB, AC, and BC.
To Do
Create a spreadsheet similar to Tables 8.6 and 8.7 to answer the following:
- a. Calculate the average return for each individual stock.
- b. Calculate the standard deviation for each individual stock.
- c. Calculate the average returns for portfolios AB, AC, and BC.
- d. Calculate the standard deviations for portfolios AB, AC, and BC.
- e. Would you recommend that Jane invest in the single stock A or the portfolio consisting of stocks A and B? Explain your answer from a risk-return viewpoint
- f. Would you recommend that Jane invest in the single stock B or the portfolio consisting of stocks B and C? Explain your answer from a risk-return viewpoint
My Lab Finance Visit www.pearson.com/mylab/finance for Chapter Case: Analyzing Risk and Return on Chargers Products’ Investments, Group Exercises, and numerous online resources.
Want to see the full answer?
Check out a sample textbook solution
Chapter 8 Solutions
EBK PEARSON ETEXT PRINCIPLES OF MANAGER


- required rates of return for the three securities? 6-23. (Portfolio beta and security market line) You own a portfolio consisting of the ☑ stocks below: PERCENTAGE OF STOCK OR SECURITY PORTFOLIO BETA EXPECTED RETURN 1 20% 1.00 12% 2 30% 0.85 8% 3 15% 1.20 12% 25% 0.60 7% 5 10% 1.60 16% The risk-free rate is 3 percent. Also, the expected return on the market portfolio is 11 percent. a. Calculate the expected return of your portfolio. (Hint: The expected return of a portfolio equals the weighted average of the individual stocks' expected returns, where the weights are the percentage invested in each stock.) b. Calculate the portfolio beta. c. Given the foregoing information, plot the security market line on paper. Plot the stocks from your portfolio on your graph. d. From your plot in part (c), which stocks appear to be your winners and which ones appear to be your losers? e. Why should you consider your conclusion in part (d) to be less than certain? 6-24. (Portfolio beta) Assume you…arrow_forwardWizzy Wigs is an unleveraged firm with $80 million in total assets, 2 million shares outstanding, and $15 million in EBIT. The shares price is $40, tax adjusted cost of debt 4.61%, and corporate tax rate of 21%. What are the returns on equity (ROEs) for the firm if it shifts to a 0.75 debt-to-equity ratio and for an individual with 700 shares who created homemade leverage at the same DE ratio? ◻ firm 25.61%; inv. 24.99% firm 18.24%; inv. 19.46% firm 38.59%; inv. 35.53% firm 23.19%; inv. 22.46% firm 30.07%; inv. 30.19% Please show work on excel spreadsheetarrow_forwardYou are running a hot Internet company. Analysts predict that its earnings will grow at 20% per year for the next 9 years. After that, as competition increases, earnings growth is expected to slow to 4% per year and continue at that level forever. Your company has just announced earnings of $4 million. What is the present value of all future earnings if the interest rate is 9%? (Assume all cash flows occur at the end of the year.) The present value of all future earnings is million. (Round to two decimal places.)arrow_forward
- 3. Losses for an insurance company next year are estimated to be 100 million with standard deviation 250 million. Using lognormal and two-parameter Pareto distributions to obtain the VaR at the 95%, 97.5%, 99% security levels. Comment on your findings.arrow_forwardA company sold 4 million shares in its IPO, at a priceof $18.50 per share. Management negotiated a fee(the underwriting spread) of 7% on this transaction.What was the dollar cost of this fee?arrow_forwardConsider the following three bonds (see Table 1), which all have a par value of $100 and pay coupons semiannually if the coupon rate is not zero. What is the 6.5-year spot rate on a BEY basis? Bond Coupon Rate Price Maturity(yrs) A 106 3 6 75 B 0 6 115 C 4 6.5arrow_forward
- Problem 6-8 Project Evaluation Dog Up! Franks is looking at a new sausage system with an installed cost of $445,000. This cost will be depreciated straight-line to zero over the project's five-year life, at the end of which the sausage system can be scrapped for $53,000. The sausage system will save the firm $139,000 per year in pretax operating costs, and the system requires an initial investment in net working capital of $25,000. If the tax rate is 23 percent and the discount rate is 11 percent, what is the NPV of this project? (Do not round intermediate calculations and round your answer to 2 decimal places, e.g., 32.16.) NPVarrow_forwardAn investment has an expected return of X percent per year, is expected to make annual payments of $3,170 for 7 years, is worth $14,532, and the first payment is expected in 1 year What is X? Input instructions: Input your answer as the number that appears before the percentage sign. For example, enter 9.86 for 9.86% (do not enter .0986 or 9.86%). Round your answer to at least 2 decimal places. percentarrow_forwardYou just took out a loan for $29,449 that requires annual payments of $4,570 for 20 years. The interest rate on the loan is X percent per year and the first regular payment will be made in 1 year. What is X? Input instructions: Input your answer as the number that appears before the percentage sign. For example, enter 9.86 for 9.86% (do not enter .0986 or 9.86%). Round your answer to at least 2 decimal places. percentarrow_forward
- Could you please help explain the follow-up interviews in a data collecting method? How is to use the follow-up interviews in qualitative data collection methods? Could the qualitative data collection methods can be used in the thematic analysis?arrow_forwardWe often hear about the importance of financial statement analysis. Given the various statements prepared and all the information included therein, the question becomes which of the financial statements should get a closer review and why? Explain what the basic financial statements are and what is the purpose of each statement. Within the different statements, in your opinion what is/are the key areas of information to focus on and why? Be specific as to the importance of your selection.arrow_forwardDon't used hand raiting and don't used Ai solutionarrow_forward
 Pfin (with Mindtap, 1 Term Printed Access Card) (...FinanceISBN:9780357033609Author:Randall Billingsley, Lawrence J. Gitman, Michael D. JoehnkPublisher:Cengage Learning