Concept explainers
Videos
What is a cross join? Give an example of its syntax.
Join:
Join is a relational operation, which combines the data from two or more tables into single table or view, then that is called as Join.
Explanation of Solution
CROSS join:
- It is a type of join operation that performs Cartesian product of two tables.
- That is, it produces a result set in which the rows from first table are multiplied with the rows from second table.
Syntax:
SELECT * FROM table_1 CROSS JOIN table_2;
Example:
Table creation:
Creating table 1:
CREATE TABLE table_1 (Item_ID int, Item_Name varchar(10), Company_ID int primary key);
Creating table 1:
CREATE TABLE table_2 (Company_ID int references table_1, Company_Name varchar(10), Company_city varchar(10));
Inserting values:
Inserting values to table 1:
INSERT INTO table_1 values (1, "Pancakes", 101);
INSERT INTO table_1 values (2, "Rice", 109);
INSERT INTO table_1 values (3, "Cakes", 106);
Inserting values to table 1:
INSERT INTO table_2 values (106, "AAA", "ZZZ");
INSERT INTO table_2 values (109, "BBB", "YYY");
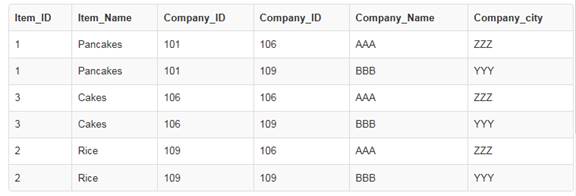
Query using “CROSS JOIN”:
SELECT * FROM table_1 CROSS JOIN table_2;
Screenshot of the result:
Want to see more full solutions like this?
Chapter 8 Solutions
Database Systems: Design, Implementation, & Management


- Complete the JavaScript function addPixels () to calculate the sum of pixelAmount and the given element's cssProperty value, and return the new "px" value. Ex: If helloElem's width is 150px, then calling addPixels (hello Elem, "width", 50) should return 150px + 50px = "200px". SHOW EXPECTED HTML JavaScript 1 function addPixels (element, cssProperty, pixelAmount) { 2 3 /* Your solution goes here *1 4 } 5 6 const helloElem = document.querySelector("# helloMessage"); 7 const newVal = addPixels (helloElem, "width", 50); 8 helloElem.style.setProperty("width", newVal); [arrow_forwardSolve in MATLABarrow_forwardHello please look at the attached picture. I need an detailed explanation of the architecturearrow_forward
- Information Security Risk and Vulnerability Assessment 1- Which TCP/IP protocol is used to convert the IP address to the Mac address? Explain 2-What popular switch feature allows you to create communication boundaries between systems connected to the switch3- what types of vulnerability directly related to the programmer of the software?4- Who ensures the entity implements appropriate security controls to protect an asset? Please do not use AI and add refrencearrow_forwardFind the voltage V0 across the 4K resistor using the mesh method or nodal analysis. Note: I have already simulated it and the value it should give is -1.714Varrow_forwardResolver por superposicionarrow_forward
- Describe three (3) Multiplexing techniques common for fiber optic linksarrow_forwardCould you help me to know features of the following concepts: - commercial CA - memory integrity - WMI filterarrow_forwardBriefly describe the issues involved in using ATM technology in Local Area Networksarrow_forward
- For this question you will perform two levels of quicksort on an array containing these numbers: 59 41 61 73 43 57 50 13 96 88 42 77 27 95 32 89 In the first blank, enter the array contents after the top level partition. In the second blank, enter the array contents after one more partition of the left-hand subarray resulting from the first partition. In the third blank, enter the array contents after one more partition of the right-hand subarray resulting from the first partition. Print the numbers with a single space between them. Use the algorithm we covered in class, in which the first element of the subarray is the partition value. Question 1 options: Blank # 1 Blank # 2 Blank # 3arrow_forward1. Transform the E-R diagram into a set of relations. Country_of Agent ID Agent H Holds Is_Reponsible_for Consignment Number $ Value May Contain Consignment Transports Container Destination Ф R Goes Off Container Number Size Vessel Voyage Registry Vessel ID Voyage_ID Tonnagearrow_forwardI want to solve 13.2 using matlab please helparrow_forward

 Database Systems: Design, Implementation, & Manag...Computer ScienceISBN:9781305627482Author:Carlos Coronel, Steven MorrisPublisher:Cengage Learning
 Database Systems: Design, Implementation, & Manag...Computer ScienceISBN:9781285196145Author:Steven, Steven Morris, Carlos Coronel, Carlos, Coronel, Carlos; Morris, Carlos Coronel and Steven Morris, Carlos Coronel; Steven Morris, Steven Morris; Carlos CoronelPublisher:Cengage Learning
 A Guide to SQLComputer ScienceISBN:9781111527273Author:Philip J. PrattPublisher:Course Technology Ptr
 Np Ms Office 365/Excel 2016 I NtermedComputer ScienceISBN:9781337508841Author:CareyPublisher:Cengage