
Concept explainers
Videos
The Data Bank is found in Appendix B, or on the World Wide Web by following links from www.mhhe.com/math/stats/bluman/
1. From the Data Bank, select a random sample of at least 30 individuals, and test one or more of the following hypotheses by using the z test. Use α = 0.05.
a. For serum cholesterol, H0: μ = 220 milligram percent (mg%). Use σ = 5.
b. For systolic pressure, H0: μ = 120 millimeters of mercury (mm Hg). Use σ = 13.
c. For IQ, H0: μ = 100. Use σ = 15.
d. For sodium level, H0: μ = 140 milliequivalents per liter (mEq/l). Use σ = 6.
a.
To test: The claim that
Answer to Problem 1DA
The conclusion is that there is sufficient evidence to infer that the average serum cholesterol level is differs from 220 milligram percent (mg%).
Explanation of Solution
Answer will vary. One of the possible answers is given below:
Given info:
Claim:
Calculation:
State the null and alternative hypotheses:
Null hypothesis:
Alternative hypothesis:
Test statistic value and P-value:
Software procedure:
Step by step procedure to obtain the test value using the MINITAB software:
- Choose Stat > Basic Statistics > 1-Sample Z.
- In Samples in Column, enter the column of Serum cholesterol.
- In Standard deviation, enter 5.
- In Perform hypothesis test, enter the test mean as 220.
- Check Options; enter Confidence level as 95%.
- Choose not equal in alternative.
- Click OK in all dialogue boxes.
Output using the MINITAB software is given below:
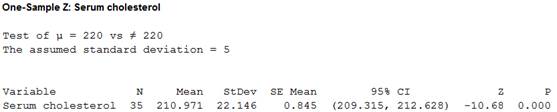
From the output, the test value is –10.68 and the P-value is 0.000.
Make the Decision:
Decision rule:
If
If
Here, the P-value is lesser than the level of significance.
That is,
By the decision rule, the null hypothesis is rejected.
Thus, the decision is “reject the null hypothesis”.
Summarize the result:
There is sufficient evidence to infer that the average serum cholesterol level is differs from 220 milligram percent (mg%).
b.
To test: The claim that
Answer to Problem 1DA
The conclusion is that there is sufficient evidence to infer that the average systolic pressure is differs from 120 millimeters of mercury (mm Hg).
Explanation of Solution
Given info:
Claim:
Calculation:
State the null and alternative hypotheses:
Null hypothesis:
Alternative hypothesis:
Test statistic value and P-value:
Software procedure:
Step by step procedure to obtain the test value using the MINITAB software:
- Choose Stat > Basic Statistics > 1-Sample Z.
- In Samples in Column, enter the column of Systolic pressure.
- In Standard deviation, enter 13.
- In Perform hypothesis test, enter the test mean as 120.
- Check Options; enter Confidence level as 95%.
- Choose not equal in alternative.
- Click OK in all dialogue boxes.
Output using the MINITAB software is given below:
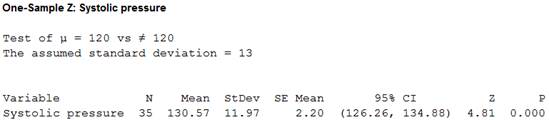
From the output, the test value is 4.81 and the P-value is 0.000.
Make the Decision:
Here, the P-value is lesser than the level of significance.
That is,
By the decision rule, the null hypothesis is rejected.
Thus, the decision is “reject the null hypothesis”.
Summarize the result:
There is sufficient evidence to infer that the average systolic pressure is differs from 120 millimetres of mercury (mm Hg).
c.
To test: The claim that
Answer to Problem 1DA
The conclusion is that there is sufficient evidence to infer that the average IQ score is differs from 100.
Explanation of Solution
Given info:
Claim:
Calculation:
State the null and alternative hypotheses:
Null hypothesis:
Alternative hypothesis:
Test statistic value and P-value:
Software procedure:
Step by step procedure to obtain the test value using the MINITAB software:
- Choose Stat > Basic Statistics > 1-Sample Z.
- In Samples in Column, enter the column of IQ.
- In Standard deviation, enter 15.
- In Perform hypothesis test, enter the test mean as 100.
- Check Options; enter Confidence level as 95%.
- Choose not equal in alternative.
- Click OK in all dialogue boxes.
Output using the MINITAB software is given below:
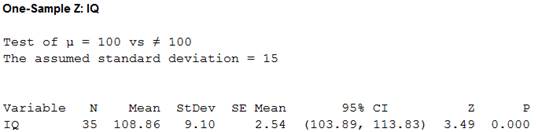
From the output, the test value is 3.49 and the P-value is 0.000.
Make the Decision:
Here, the P-value is lesser than the level of significance.
That is,
By the decision rule, the null hypothesis is rejected.
Thus, the decision is “reject the null hypothesis”.
Summarize the result:
There is sufficient evidence to infer that the average IQ score is differs from 100.
d.
To test: The claim that
Answer to Problem 1DA
The conclusion is that there is sufficient evidence to infer that the average sodium level is 140.
Explanation of Solution
Given info:
Claim:
Calculation:
State the null and alternative hypotheses:
Null hypothesis:
Alternative hypothesis:
Test statistic value and P-value:
Software procedure:
Step by step procedure to obtain the test value using the MINITAB software:
- Choose Stat > Basic Statistics > 1-Sample Z.
- In Samples in Column, enter the column of Sodium level.
- In Standard deviation, enter 6.
- In Perform hypothesis test, enter the test mean as 140.
- Check Options; enter Confidence level as 95%.
- Choose not equal in alternative.
- Click OK in all dialogue boxes.
Output using the MINITAB software is given below:
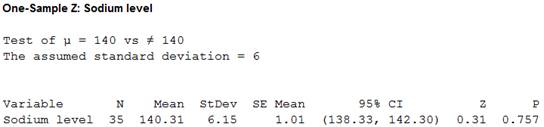
From the output, the test value is 0.31 and the P-value is 0.757.
Make the Decision:
Here, the P-value is greater than the level of significance.
That is,
By the decision rule, the null hypothesis is not rejected.
Thus, the decision is “fail to reject the null hypothesis”.
Summarize the result:
There is sufficient evidence to infer that the average sodium level is 140.
Want to see more full solutions like this?
Chapter 8 Solutions
Elementary Statistics: A Step-by-Step Approach with Formula Card
Additional Math Textbook Solutions
Pathways To Math Literacy (looseleaf)
Elementary Algebra For College Students (10th Edition)
A First Course in Probability (10th Edition)
Elementary Statistics: Picturing the World (7th Edition)
Algebra and Trigonometry (6th Edition)


- The following ordered data list shows the data speeds for cell phones used by a telephone company at an airport: A. Calculate the Measures of Central Tendency from the ungrouped data list. B. Group the data in an appropriate frequency table. C. Calculate the Measures of Central Tendency using the table in point B. 0.8 1.4 1.8 1.9 3.2 3.6 4.5 4.5 4.6 6.2 6.5 7.7 7.9 9.9 10.2 10.3 10.9 11.1 11.1 11.6 11.8 12.0 13.1 13.5 13.7 14.1 14.2 14.7 15.0 15.1 15.5 15.8 16.0 17.5 18.2 20.2 21.1 21.5 22.2 22.4 23.1 24.5 25.7 28.5 34.6 38.5 43.0 55.6 71.3 77.8arrow_forwardII Consider the following data matrix X: X1 X2 0.5 0.4 0.2 0.5 0.5 0.5 10.3 10 10.1 10.4 10.1 10.5 What will the resulting clusters be when using the k-Means method with k = 2. In your own words, explain why this result is indeed expected, i.e. why this clustering minimises the ESS map.arrow_forwardwhy the answer is 3 and 10?arrow_forward
- PS 9 Two films are shown on screen A and screen B at a cinema each evening. The numbers of people viewing the films on 12 consecutive evenings are shown in the back-to-back stem-and-leaf diagram. Screen A (12) Screen B (12) 8 037 34 7 6 4 0 534 74 1645678 92 71689 Key: 116|4 represents 61 viewers for A and 64 viewers for B A second stem-and-leaf diagram (with rows of the same width as the previous diagram) is drawn showing the total number of people viewing films at the cinema on each of these 12 evenings. Find the least and greatest possible number of rows that this second diagram could have. TIP On the evening when 30 people viewed films on screen A, there could have been as few as 37 or as many as 79 people viewing films on screen B.arrow_forwardQ.2.4 There are twelve (12) teams participating in a pub quiz. What is the probability of correctly predicting the top three teams at the end of the competition, in the correct order? Give your final answer as a fraction in its simplest form.arrow_forwardThe table below indicates the number of years of experience of a sample of employees who work on a particular production line and the corresponding number of units of a good that each employee produced last month. Years of Experience (x) Number of Goods (y) 11 63 5 57 1 48 4 54 5 45 3 51 Q.1.1 By completing the table below and then applying the relevant formulae, determine the line of best fit for this bivariate data set. Do NOT change the units for the variables. X y X2 xy Ex= Ey= EX2 EXY= Q.1.2 Estimate the number of units of the good that would have been produced last month by an employee with 8 years of experience. Q.1.3 Using your calculator, determine the coefficient of correlation for the data set. Interpret your answer. Q.1.4 Compute the coefficient of determination for the data set. Interpret your answer.arrow_forward
- Can you answer this question for mearrow_forwardTechniques QUAT6221 2025 PT B... TM Tabudi Maphoru Activities Assessments Class Progress lIE Library • Help v The table below shows the prices (R) and quantities (kg) of rice, meat and potatoes items bought during 2013 and 2014: 2013 2014 P1Qo PoQo Q1Po P1Q1 Price Ро Quantity Qo Price P1 Quantity Q1 Rice 7 80 6 70 480 560 490 420 Meat 30 50 35 60 1 750 1 500 1 800 2 100 Potatoes 3 100 3 100 300 300 300 300 TOTAL 40 230 44 230 2 530 2 360 2 590 2 820 Instructions: 1 Corall dawn to tha bottom of thir ceraan urina se se tha haca nariad in archerca antarand cubmit Q Search ENG US 口X 2025/05arrow_forwardThe table below indicates the number of years of experience of a sample of employees who work on a particular production line and the corresponding number of units of a good that each employee produced last month. Years of Experience (x) Number of Goods (y) 11 63 5 57 1 48 4 54 45 3 51 Q.1.1 By completing the table below and then applying the relevant formulae, determine the line of best fit for this bivariate data set. Do NOT change the units for the variables. X y X2 xy Ex= Ey= EX2 EXY= Q.1.2 Estimate the number of units of the good that would have been produced last month by an employee with 8 years of experience. Q.1.3 Using your calculator, determine the coefficient of correlation for the data set. Interpret your answer. Q.1.4 Compute the coefficient of determination for the data set. Interpret your answer.arrow_forward
 Glencoe Algebra 1, Student Edition, 9780079039897...AlgebraISBN:9780079039897Author:CarterPublisher:McGraw Hill