
Videos
Young Professional Magazine
Young Professional magazine was developed for a target audience of recent college graduates who are in their first 10 years in a business/professional career. In its two years of publication, the magazine has been fairly successful. Now the publisher is interested in expanding the magazine’s advertising base. Potential advertisers continually ask about the demographics and interests of subscribers to Young Professional. To collect this information. the magazine commissioned a survey to develop a profile of its subscribers. The survey results will be used to help the magazine choose articles of interest and provide advertisers with a profile of subscribers. As a new employee of the magazine, you have been asked to help analyze the survey results.
Some of the survey questions follow:
Professional
- 1. What is your age?
- 2. Are you: Male_______ Female_______
- 3. Do you plan to make any real estate purchases in the next two years? Yes____ No____
- 4. What is the approximate total value of financial investments, exclusive of your home, owned by you or members of your household?
- 5. How many stock/bond/mutual fund transactions have you made in the past year?
- 6. Do you have broadband access to the Internet at home? Yes____ No____
- 7. Please indicate your total household income last year._______
8. Do you have children? Yes____ No____
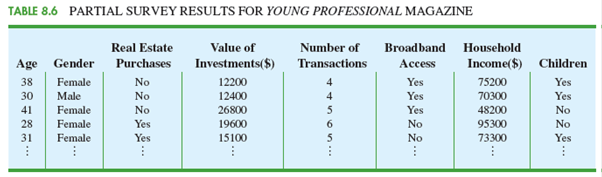
The file entitled Professional contains the responses to these questions. Table 8.6 shows the portion of the file pertaining to the first five survey respondents.
Managerial Report
Prepare a managerial report summarizing the results of the survey. In addition to statistical summaries, discuss how the magazine might use these results to attract advertisers. You might also comment on how the survey results could be used by the magazine’s editors to identify topics that would be of interest to readers. Your report should address the following issues, but do not limit your analysis to just these areas.
- 1. Develop appropriate
descriptive statistics to summarize the data. - 2. Develop 95% confidence intervals for the
mean age and household income of subscribers. - 3. Develop 95% confidence intervals for the proportion of subscribers who have broadband access at home and the proportion of subscribers who have children.
- 4. Would Young Professional be a good advertising outlet for online brokers? Justify your conclusion with statistical data.
- 5. Would this magazine be a good place to advertise for companies selling educational software and computer games for young children?
- 6. Comment on the types of articles you believe would be of interest to readers of Young Professional.

Trending nowThis is a popular solution!

Chapter 8 Solutions
Essentials of Statistics for Business and Economics


- 9. The concentration function of a random variable X is defined as Qx(h) = sup P(x ≤ X ≤x+h), h>0. Show that, if X and Y are independent random variables, then Qx+y (h) min{Qx(h). Qr (h)).arrow_forward10. Prove that, if (t)=1+0(12) as asf->> O is a characteristic function, then p = 1.arrow_forward9. The concentration function of a random variable X is defined as Qx(h) sup P(x ≤x≤x+h), h>0. (b) Is it true that Qx(ah) =aQx (h)?arrow_forward
- 3. Let X1, X2,..., X, be independent, Exp(1)-distributed random variables, and set V₁₁ = max Xk and W₁ = X₁+x+x+ Isk≤narrow_forward7. Consider the function (t)=(1+|t|)e, ER. (a) Prove that is a characteristic function. (b) Prove that the corresponding distribution is absolutely continuous. (c) Prove, departing from itself, that the distribution has finite mean and variance. (d) Prove, without computation, that the mean equals 0. (e) Compute the density.arrow_forward1. Show, by using characteristic, or moment generating functions, that if fx(x) = ½ex, -∞0 < x < ∞, then XY₁ - Y2, where Y₁ and Y2 are independent, exponentially distributed random variables.arrow_forward
- 1. Show, by using characteristic, or moment generating functions, that if 1 fx(x): x) = ½exarrow_forward1990) 02-02 50% mesob berceus +7 What's the probability of getting more than 1 head on 10 flips of a fair coin?arrow_forward9. The concentration function of a random variable X is defined as Qx(h) sup P(x≤x≤x+h), h>0. = x (a) Show that Qx+b(h) = Qx(h).arrow_forward
- Suppose that you buy a lottery ticket, and you have to pick six numbers from 1 through 50 (repetitions allowed). Which combination is more likely to win: 13, 48, 17, 22, 6, 39 or 1, 2, 3, 4, 5, 6? barrow_forward2 Make a histogram from this data set of test scores: 72, 79, 81, 80, 63, 62, 89, 99, 50, 78, 87, 97, 55, 69, 97, 87, 88, 99, 76, 78, 65, 77, 88, 90, and 81. Would a pie chart be appropriate for this data? ganizing Quantitative Data: Charts and Graphs 45arrow_forward10 Meteorologists use computer models to predict when and where a hurricane will hit shore. Suppose they predict that hurricane Stat has a 20 percent chance of hitting the East Coast. a. On what info are the meteorologists basing this prediction? b. Why is this prediction harder to make than your chance of getting a head on your next coin toss? U anoiaarrow_forward
 Glencoe Algebra 1, Student Edition, 9780079039897...AlgebraISBN:9780079039897Author:CarterPublisher:McGraw Hill
 Holt Mcdougal Larson Pre-algebra: Student Edition...AlgebraISBN:9780547587776Author:HOLT MCDOUGALPublisher:HOLT MCDOUGAL
 Big Ideas Math A Bridge To Success Algebra 1: Stu...AlgebraISBN:9781680331141Author:HOUGHTON MIFFLIN HARCOURTPublisher:Houghton Mifflin Harcourt
 Functions and Change: A Modeling Approach to Coll...AlgebraISBN:9781337111348Author:Bruce Crauder, Benny Evans, Alan NoellPublisher:Cengage Learning