
Subpart (a):
Equilibrium price .
Subpart (a):
Explanation of Solution
The equilibrium
We have given the supply equation and the demand equations and we can equate them in order to obtain the equilibrium price as follows:
Thus, the equilibrium price is $100. Now we can calculate the equilibrium quantity by substituting the equilibrium price in the equations as follows:
Thus, the equilibrium quantity is 200 units.
Concept introduction:
Equilibrium: It is the
Subpart (b):
Equilibrium price.
Subpart (b):
Explanation of Solution
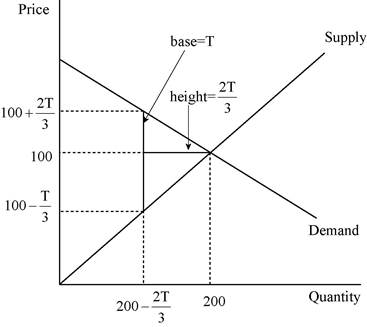
We have given the supply equation and the demand equation changes due to the tax on consumers and the new demand equation is
Thus, the price received by the producers is
Thus, the quantity is now
Concept introduction:
Equilibrium: It is the market equilibrium which is determined by equating the supply to the demand. At this equilibrium point, the supply will be equal to the demand and there will be no excess demand or excess supply in the economy. Thus, the economy will be at equilibrium.
Subpart (c):
Total tax revenue.
Subpart (c):
Explanation of Solution
We have given that the tax revenue equals to the tax rate multiplied with the quantity. The quantity is calculated in part b as
This relation between the tax revenue can be illustrated as follows:
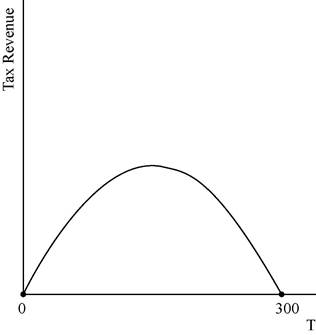
The graph depicts that the tax revenue will be zero at the tax levels of T = $0 and also at the tax rate of T = $300.
Concept introduction:
Tax: It is the unilateral payment made by the public towards the government. There are many different types of taxes in the economy which include the income tax, property tax and professional tax and so forth.
Tax revenue: Tax revenue refers to the total revenue earned by the government through imposing tax.
Subpart (d):
Deadweight loss .
Subpart (d):
Explanation of Solution
We have given that deadweight loss is the area of the triangle between the demand and supply curves. The following diagram shows, the area of the triangle (laid on its side) that represents the deadweight loss is 1/2 × base × height, where the base is the change in the price, which is the size of the tax (T) and the height is the amount of the decline in quantity (
The deadweight loss can be calculated as follows:
Thus, the deadweight loss is equal to
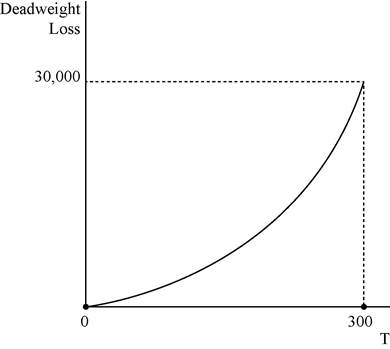
In the above diagram horizontal axis measures quantity and vertical axis measures deadweight loss.
Concept introduction:
Tax: It is the unilateral payment made by the public towards the government. There are many different types of taxes in the economy which include the income tax, property tax and professional tax and so forth.
Deadweight loss: It is the reduction in the units where the marginal benefit to the consumer is higher than the marginal cost of production of the unit.
Subpart (e):
Determine the tax amount.
Subpart (e):
Explanation of Solution
A tax of $200 will not turn out to be a good policy because the tax revenue decreases when the tax rate reaches to $300 where the tax revenue is zero. The tax revenue is at its maximum at the middle of the tax rate of $0 and $300 which is $150. Thus, in order to increase the tax revenue, the government should reduce the tax rate to $150 from $200 which will be the good alternative policy.
Concept introduction:
Tax: It is the unilateral payment made by the public towards the government. There are many different types of taxes in the economy which include the income tax, property tax and professional tax and so forth.
Want to see more full solutions like this?
Chapter 8 Solutions
Principles of Microeconomics, 7th Edition (MindTap Course List)

- Everything is in attached picture. 23arrow_forward1) Use the supply and demand schedules to graph the supply and demand functions. Find and show on the graph the equilibrium price and quantity, label it (A). P Q demanded P Q supplied 0 75 0 0 5 65 5 0 10 55 10 0 15 45 15 10 20 35 20 20 25 25 25 30 30 15 30 40 35 40 5 0 35 40 50 60 2) Find graphically and numerically the consumers and producers' surplus 3) The government introduced a tax of 10$, Label the price buyers pay and suppliers receive. Label the new equilibrium for buyers (B) and Sellers (S). How the surpluses have changed? Give the numerical answer and show on the graph. 4) Calculate using midpoint method the elasticity of demand curve from point (A) to (B) and elasticity of the supply curve from point (A) to (C).arrow_forwardFour heirs (A, B, C, and D) must divide fairly an estate consisting of three items — a house, a cabin and a boat — using the method of sealed bids. The players' bids (in dollars) are: In the initial allocation, player D Group of answer choices gets no items and gets $62,500 from the estate. gets the house and pays the estate $122,500. gets the cabin and gets $7,500 from the estate. gets the boat and and gets $55,500 from the estate. none of thesearrow_forward
- Jack and Jill are getting a divorce. Except for the house, they own very little of value so they agree to divide the house fairly using the method of sealed bids. Jack bids 140,000 and Jill bids 160,000. After all is said and done, the final outcome is Group of answer choices Jill gets the house and pays Jack $80,000. Jill gets the house and pays Jack $75,000. Jill gets the house and pays Jack $70,000. Jill gets the house and pays Jack $65,000. none of thesearrow_forwardThe problem statement never defines whether the loan had compound or simple interest. The readings indicate that the diference in those will be learned later, and the formula used fro this answer was not in the chapter. Should it be assumbed that a simple interest caluclaton should be used?arrow_forwardNot use ai pleasearrow_forward
 Microeconomics: Principles & PolicyEconomicsISBN:9781337794992Author:William J. Baumol, Alan S. Blinder, John L. SolowPublisher:Cengage Learning


