
Concept explainers
Videos
Modeling Data The manufacturer of a boat needs approximate the center of mass of a section of the hull,
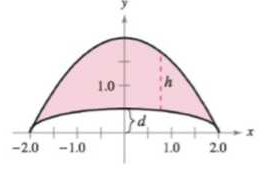
| x | 0 | 0.5 | 1.0 | 1.5 | 2 |
| h | 1.50 | 1.45 | 1.30 | 0.99 | 0 |
| d | 0.50 | 0.48 | 0.43 | 0.33 | 0 |
(a) Use the regression capabilities of a graphing utility to find fourth-degree polynomial models for both curves shown in the figure.
(b) Use the
Want to see the full answer?
Check out a sample textbook solution
Chapter 7 Solutions
EBK CALCULUS
Additional Math Textbook Solutions
Calculus: Early Transcendentals (2nd Edition)
Math in Our World
Basic College Mathematics
A Problem Solving Approach To Mathematics For Elementary School Teachers (13th Edition)
Elementary Statistics
Precalculus: A Unit Circle Approach (3rd Edition)


- x The function f is shown below. If I is the function defined by g(x) = √ ƒ(t) dt, find the value of g"(-8) in simplest form. g -1 8 y 7 10 6 LC 5 4 3 2 1 -10 -9 -8 -7 -6 -5 -4 -3 -2 -1 1 2 3 -1 -2 -3 -4 -5 56 -6 -7 -8 4 5 Graph of f 10 6 00 7 8 9 10 xarrow_forwardThe function f is shown below. If g is an antiderivative of f such that g(6) = 2, what is the maximum value of g on the closed interval [-9,9]? 8 7 6 Сл 5 4 3 1 y Graph of f -10 -9 -8 -7 -6 -5 -4 -3 -2 -1 1 23 4 -1 -2 -3 -4 -6 56 -5 -7 -8 LO 5 9 7 8 9 10arrow_forwardx The function of is shown below. If I is the function defined by g(x) = [* f(t)dt, write the equation of the line tangent to the graph of 9 at x = -3. g y Graph of f 8 7 6 5 4 32 1 x -10 -9 -8 -7 -6 -5 -4 -3 -2 -1 1 2 3 4 5 6 7 8 9 10 -1 -2 -3 56 -6 -7 -8arrow_forward
- Let f(x)=4excosxf'(x)=arrow_forwardThe graph of the function f in the figure below consists of line segments and a quarter of a circle. Let g be the function given by x g(x) = __ f (t)dt. Determine all values of a, if any, where g has a point of inflection on the open interval (-9, 9). 8 y 7 76 LO 5 4 3 2 1 -10 -9 -8 -7 -6 -5 -4 -3 -2 -1 1 2 3 ♡. -1 -2 3 -4 56 -5 -6 -7 -8 Graph of f 4 5 16 7 8 9 10arrow_forwardThe areas of the regions bounded by the graph of the function f and the x-axis are labeled in the figure below. Let the function g be C defined by the equation g(x) = [* f(t)dt. What is the maximum value of the function g on the closed interval [-7, 8]? 17 y Graph of f 00 8 76 5 4 3 2 1 -10 -9 -8 -7 -6 -5 -4 -3-2-1 -2 702 4 1 21 3 4 568 -4 -5 --6 -7 -8 x 5 6 7 8 9 10 17arrow_forward
- A tank holds a 135 gal solution of water and salt. Initially, the solution contains 21 lb of salt. A salt solution with a concentration of 3 lb of salt per gal begins flowing into the tank at the rate of 3 gal per minute. The solution in the tank also begins flowing out at a rate of 3 gal per minute. Let y be the amount of salt present in the tank at time t. (a) Find an expression for the amount of salt in the tank at any time. (b) How much salt is present after 51 minutes? (c) As time increases, what happens to the salt concentration?arrow_forwardSolve please and thanks!arrow_forwardSolve please and thanks!arrow_forward
 Algebra & Trigonometry with Analytic GeometryAlgebraISBN:9781133382119Author:SwokowskiPublisher:Cengage
 Trigonometry (MindTap Course List)TrigonometryISBN:9781337278461Author:Ron LarsonPublisher:Cengage Learning
 Holt Mcdougal Larson Pre-algebra: Student Edition...AlgebraISBN:9780547587776Author:HOLT MCDOUGALPublisher:HOLT MCDOUGAL