Videos
The figure shows the healthy weight region for various heights for people ages 35 and older.
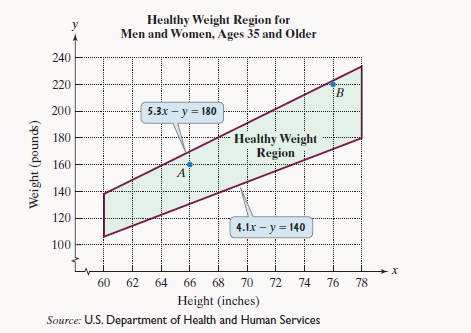
If x represents height, in inches, and y represents weight, in pounds, the healthy weight region can be modeled by the following system of linear inequalities:
Use this information to solve Exercises 45-48.
The figure shows the healthy weight region for various heights for people ages 35 and older.
If x represents height, in inches, and y represents weight, in pounds, the healthy weight region can be modeled by the following system of linear inequalities:
Use this information to solve Exercises 45-48.
Show that point B is a solution of the system of inequalities that describes healthy weight for this age group.
Want to see the full answer?
Check out a sample textbook solution
Chapter 7 Solutions
Thinking Mathematically plus NEW MyLab Math with Pearson eText -- Access Card Package (6th Edition)


- Graph y= log(x − 1) +4 10+ 9 8 7 6 5 4 32 1 10 -9 -8 -7 -6 -5 -4 -3 -2 -1 1 2 3 4 5 -1 6 7 8 9 10 -2 -3 -4 -5 -6 -7 -8 -9 -10arrow_forwardNo chatgpt pls will upvote Already got wrong chatgpt answerarrow_forwardLacy is a single taxpayer. In 2024, her taxable income is $56,000. What is her tax liability in each of the following alternative situations. All of her income is salary from her employer. What is her tax liability?arrow_forward
- Write an equation for the graph shown below. 5 4 3 2 1 -5-4-3-2-1 -1 1 2 3 4 5 f(x) = -2 -3 -4 -5arrow_forwardN = mg Ö == 6 mL mL - - (Ö sin(0) – ė² cos(0)) 2 - (N) * (µ cos(0) − sin(0)) 12 * g * cos(0) = 12g L + (3 * cos(0)) L mL μ * N = - (Ö cos(0) – 0² sin(0)) 2 Solve for mu in terms of theta, fully simplify (a lot of algebra) should get mu = function(theta)arrow_forward1. We want to graph the function f(x) log4 x. In a table below, = find at three points with nice integer y-values (no rounding!) and then graph the function at right. Be sure to clearly indicate any asymptotes. (4 points) 3 2 1- -1 0 1 2 3 4 5 10 X log4(x) -1 -2 -3- 6 7 8 00arrow_forward
- Graph y=log2(x+3) 10+ 9 8 7- 6 5 4 3 3 2 1 10 -9 -8 -7 -6 -5 -4 -3-2-1 1 2 3 4 5 6 7 8 7 8 9 10 -1 -2 -3 -4 -5 -6 -7- -8 -9 -10 Clear All Drawarrow_forwardWrite an equation for the graph below. +10+ 9 10 -9 -8 -7 -6 -5 -4 -3-2-1 8 7 6 5 4 3 2 1 1 3 4 5 6 7 8 9 10 -1 -2 -3 -4 -5 -6 -7 -8 f(x) = 9 -9 -10-arrow_forward3. Solve the inequality and give your answer in interval notation. Be sure to show all your work, and write neatly so your work is easy to follow. (4 points) 2|3x+12 ≥ 18arrow_forward
- - 2. In words, interpret the inequality |x8|> 7 the same way I did in the videos. Note: the words "absolute value" should not appear in your answer! (2 points)arrow_forward1. Define probability: 2. Define statistics:arrow_forwarde nearest tenth. =15 2. A = 33°, B = 29°, b = 41 -b SINA" 2c Sina SinB Sin C 4. A = 30°, B = 45°, a = 10arrow_forward
 Holt Mcdougal Larson Pre-algebra: Student Edition...AlgebraISBN:9780547587776Author:HOLT MCDOUGALPublisher:HOLT MCDOUGAL
 Algebra for College StudentsAlgebraISBN:9781285195780Author:Jerome E. Kaufmann, Karen L. SchwittersPublisher:Cengage Learning
 Glencoe Algebra 1, Student Edition, 9780079039897...AlgebraISBN:9780079039897Author:CarterPublisher:McGraw Hill
 Algebra: Structure And Method, Book 1AlgebraISBN:9780395977224Author:Richard G. Brown, Mary P. Dolciani, Robert H. Sorgenfrey, William L. ColePublisher:McDougal Littell
 College Algebra (MindTap Course List)AlgebraISBN:9781305652231Author:R. David Gustafson, Jeff HughesPublisher:Cengage Learning
 Big Ideas Math A Bridge To Success Algebra 1: Stu...AlgebraISBN:9781680331141Author:HOUGHTON MIFFLIN HARCOURTPublisher:Houghton Mifflin Harcourt