
An Introduction to Mathematical Statistics and Its Applications (6th Edition)
6th Edition
ISBN: 9780134114217
Author: Richard J. Larsen, Morris L. Marx
Publisher: PEARSON
expand_more
expand_more
format_list_bulleted
Concept explainers
Videos
Question
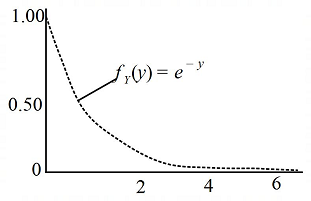
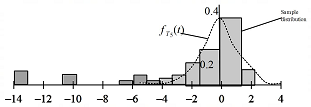
Chapter 7.4, Problem 24Q
To determine
The distribution of t ratios calculated from small samples drawn from the exponential
Expert Solution & Answer
Want to see the full answer?
Check out a sample textbook solution
Students have asked these similar questions
1. In an epidemic, the probability of having S|D is 0.2 and P(D) = 0.1. P(S|D') = 0.04 and P (D') = 0.01. What is the P(D|S)?
2. The relationship between weight and age was found to have a linear relationship, with expression weight= 3.0 (age) +10. Predict the weight of a girl whose age is 20 years?
3. A. If a z score of 1.95 is equal to a p of 0.9744, what proportion is greater than1.95
B. From question A, what proportion is between the mean and 1.95?
4. If a the constant for a regression is 0.8 and the standard deviation for the x variables is 4 while the standard deviation for the y variables is 6. What is the correlation coefficient r?
5. In a class of 20 students, twelve take mathematics and genetics, while eight take genetics only. What is the probability of selecting a student who takes only mathematics?
We analyze a data set with Y = stopping distance of a car
and X = speed of the car when the brakes were applied,
%3D
and after running the data in STATISTICA, we obtain the
following results.
Std.Err.
of b
Std.Err.
of b*
t(61)
p-value
b*
N=63
Intercept
Speed
-20.2734
3.1366
-6.26038
20.67978
0.000000
0.000000
3.238368
0.935504
0.045238
0.151674
Sums of
df
Mean
p-value
Squares
Squares
59540.15
Effect
59540.15
427.6534
0.000000
Regress.
Residual
1
8492.74
61
139.23
Total
68032.89
Speed X StopDist Y Speed squared StopDist squared Speed StopDist
65853
Total
1195
2471
28719
164951
One of the observations is (X = 39, Y = 138).
The value of the internal studentized residual is
. (final answer to 2 decimal places e.g.
2.12)
Hence, the point (39, 138)
an outlier.
(choose from is or is not)
. I’m interested in assessing whether someone’s resting heart rate (X) is related to how fast they are able to finish running a 5k race (5k is 3.1 miles) (Y). I gather data from a set of runners and want to see whether, at an alpha of 0.05, there is a significant relationship between resting heart rate and finish time. Use the data below to answer this question:
Resting Heart Rate (measured in beats/min)
Finish Time (measured in minutes) (Y)
54
30
65
33
60
35
60
32
75
35
70
36
80
45
60
36
55
29
55
27
60
30
Calculate the sum of squares for XY
__________________________
What is the correlation coefficient? Is it strong or weak? Positive or negative?
__________________________
What can we conclude?
______________________________________________________________________
Chapter 7 Solutions
An Introduction to Mathematical Statistics and Its Applications (6th Edition)
Ch. 7.3 - Show directlywithout appealing to the fact that n2...Ch. 7.3 - Find the moment-generating function for a chi...Ch. 7.3 - Prob. 3QCh. 7.3 - Use the fact that (n1)S2/2 is a chi square random...Ch. 7.3 - Let Y1,Y2,...,Yn be a random sample from a normal...Ch. 7.3 - If Y is a chi square random variable with n...Ch. 7.3 - Use Appendix Table A.4 to find (a) F.50,6,7 (b)...Ch. 7.3 - Let V and U be independent chi square random...Ch. 7.3 - Use Appendix Table A.4 to find the values of x...Ch. 7.3 - Suppose that two independent samples of size n are...
Ch. 7.3 - If the random variable F has an F distribution...Ch. 7.3 - Prob. 12QCh. 7.3 - Show that as n, the pdf of a Student t random...Ch. 7.3 - Prob. 14QCh. 7.3 - Prob. 15QCh. 7.4 - Use Appendix Table A.2 to find the following...Ch. 7.4 - What values of x satisfy the following equations?...Ch. 7.4 - Which of the following differences is larger?...Ch. 7.4 - A random sample of size n=9 is drawn from a normal...Ch. 7.4 - Suppose a random sample of size n=11 is drawn from...Ch. 7.4 - Let Y and S denote the sample mean and sample...Ch. 7.4 - Cell phones emit radio frequency energy that is...Ch. 7.4 - The following table lists the typical cost of...Ch. 7.4 - Creativity, as any number of studies have shown,...Ch. 7.4 - How long does it take to fly from Atlanta to New...Ch. 7.4 - In a nongeriatric population, platelet counts...Ch. 7.4 - If a normally distributed sample of size n=16...Ch. 7.4 - Prob. 13QCh. 7.4 - Revenues reported last week from nine boutiques...Ch. 7.4 - What confidence is associated with each of the...Ch. 7.4 - The weather station at Dismal Swamp, California,...Ch. 7.4 - Recall the Bacillus subtilis data in Question...Ch. 7.4 - Recall Case Study 5.3.1. Assess the credibility of...Ch. 7.4 - MBAs R Us advertises that its program increases a...Ch. 7.4 - In addition to the Shoshoni data of Case Study...Ch. 7.4 - A manufacturer of pipe for laying underground...Ch. 7.4 - In athletic contests, a wide-spread conviction...Ch. 7.4 - Prob. 23QCh. 7.4 - Prob. 24QCh. 7.4 - Prob. 25QCh. 7.4 - Suppose that random samples of size n are drawn...Ch. 7.4 - On which of the following sets of data would you...Ch. 7.5 - Use Appendix Table A.3 to find the following...Ch. 7.5 - Evaluate the following probabilities: (a)...Ch. 7.5 - Find the value y that satisfies each of the...Ch. 7.5 - For what value of n is each of the following...Ch. 7.5 - For df values beyond the range of Appendix Table...Ch. 7.5 - Let Y1,Y2,...,Yn be a random sample of size n from...Ch. 7.5 - Start with the fact that (n1)S2/2 has a chi square...Ch. 7.5 - A random sample of size n=19 is drawn from a...Ch. 7.5 - How long sporting events last is quite variable....Ch. 7.5 - How much interest certificates of deposit (CDs)...Ch. 7.5 - Prob. 11QCh. 7.5 - (a) Use the asymptotic normality of chi square...Ch. 7.5 - If a 90% confidence interval for 2 is reported to...Ch. 7.5 - Prob. 14QCh. 7.5 - Prob. 15QCh. 7.5 - When working properly, the amounts of cement that...Ch. 7.5 - A stock analyst claims to have devised a...
Knowledge Booster


Learn more about
Need a deep-dive on the concept behind this application? Look no further. Learn more about this topic, statistics and related others by exploring similar questions and additional content below.Similar questions
- Repeat Example 5 when microphone A receives the sound 4 seconds before microphone B.arrow_forwardThe following fictitious table shows kryptonite price, in dollar per gram, t years after 2006. t= Years since 2006 0 1 2 3 4 5 6 7 8 9 10 K= Price 56 51 50 55 58 52 45 43 44 48 51 Make a quartic model of these data. Round the regression parameters to two decimal places.arrow_forwardRecall that the general form of a logistic equation for a population is given by P(t)=c1+aebt , such that the initial population at time t=0 is P(0)=P0. Show algebraically that cP(t)P(t)=cP0P0ebt .arrow_forward
- Olympic Pole Vault The graph in Figure 7 indicates that in recent years the winning Olympic men’s pole vault height has fallen below the value predicted by the regression line in Example 2. This might have occurred because when the pole vault was a new event there was much room for improvement in vaulters’ performances, whereas now even the best training can produce only incremental advances. Let’s see whether concentrating on more recent results gives a better predictor of future records. (a) Use the data in Table 2 (page 176) to complete the table of winning pole vault heights shown in the margin. (Note that we are using x=0 to correspond to the year 1972, where this restricted data set begins.) (b) Find the regression line for the data in part ‚(a). (c) Plot the data and the regression line on the same axes. Does the regression line seem to provide a good model for the data? (d) What does the regression line predict as the winning pole vault height for the 2012 Olympics? Compare this predicted value to the actual 2012 winning height of 5.97 m, as described on page 177. Has this new regression line provided a better prediction than the line in Example 2?arrow_forwardWe are interested in using the pH of the lake water (which is easy to measure) to predict the average mercury level in fish from the lake, which is hard to measure. Let x be the pH of the lake water and Y be the average mercury level in fish from the lake. A sample of n = 10 lakes yielded the following data: Observation (i) pH (x;) Average mercury level (y;) 1 3 6 7 9 10 8.2 8.4 7.0 7.2 7.3 6.4 9.1 5.8 7.6 8.1 0.15 0.04 0.40 0.50 0.27 0.81 0.04 0.83 0.05 0.19 Suppose we fit the data with the following regression model: Y; = a+ Bx; + Ei, i = 1, ... , 10, where ɛ; ~ N(0, o²) are independent. We have the following quantities: a = E1 ; = 7.51, j = £i=1 Yi = 0.328, E1 x? = 572.71, 1 y? = 1.8922, -1 Tiyi = 22.218. n i=1 Some R output that may help. > p1 qt (p1, 8) [1] -2.896 -2.306 -1.860 -1.397 > qt (p1, 9) [1] -2.821 -2.262 -1.833 -1.383 1.397 1.860 2.306 2.896 1.383 1.833 2.262 2.821 (a) Find the ordinary least squares (OLS) estimates (denoted as â and B) of the regression coefficients…arrow_forwardWe are interested in using the pH of the lake water (which is easy to measure) to predict the average mercury level in fish from the lake, which is hard to measure. Let x be the pH of the lake water and Y be the average mercury level in fish from the lake. A sample of n = 10 lakes yielded the following data: Observation (i) pH (x;) Average mercury level (y;) 0.15 1 3 4 6 7 8 9 10 8.2 8.4 7.0 7.2 7.3 6.4 9.1 5.8 7.6 8.1 0.04 0.40 0.50 0.27 0.81 0.04 0.83 0.05 0.19 Suppose we fit the data with the following regression model: Y; = a + Bx; + Ei, i = 1, ..., 10, where ɛi ~ N (0, o?) are independent. We have the following quantities: a = E=1 ¤i = 7.51, j = E1 Yi = 0.328, 1 x = 572.71, 1 Y? = 1.8922, D-1 *iYi = 22.218. i=1 ri=1 Some R output that may help. > р1 qt (p1, 8) [1] -2.896 -2.306 -1.860 -1.397 1.397 1.860 2.306 2.896 > qt (p1, 9) [1] -2.821 -2.262 -1.833 -1.383 1.383 1.833 2.262 2.821 (a) Find the ordinary least squares (OLS) estimates (denoted as â and ß) of the regression…arrow_forward
- (6) Find the mean , variance, autocorrelation function P for the following models: a. Y= 0.6Y+e,- 0.4e t-1 1 1 b.Y, = 2+e;-¿e,s*7 4arrow_forwardAb. 104.arrow_forward4. In the study of human metabolism, it is known that daily calorie intake of a person age 25 above primarily affects the variability in weight gain. Scientists conducted an experiment to come up with a working formula of how much will be the average weight y (in kgs.) of a person age 25 if the person regularly has x calories of daily net calorie intake. It was shown that, on the average, y is related to x by the following relationship Y = In [x+ sin² (7)] + 50, x > 1. It was also observed that the each year the average weight of a person age 25 changes at a rate 1.5 kgs. per year. How fast is the average daily net calorie intake of a person changing when the person has 4 calories of daily net calorie intake?arrow_forward
- Needed to be done part c with all subparts in 30 minutesarrow_forward(22) Let X = b(6, find E(5+6x) and distribution function.arrow_forwardOtitis media is a disease that occurs frequently in the firstfew years of life and is one of the most common reasonsfor physician visits after the routine checkup. A study wasconducted to assess the frequency of otitis media in thegeneral population in the first year of life. Table 4.15 givesthe number of infants of 2500 infants who were first seen atbirth who remained disease-free by the end of the ith monthof life, i = 0, 1, . . . , 12. (Assume no infants have been lostto follow-up.) Disease-free infants ati the end of month i0 25001 24252 23753 23004 21805 20006 18757 17008 15009 130010 125011 122512 1200 Suppose an “otitis-prone family” is defined asone in which at least three siblings of five develop otitis media in the first 6 months of life. What proportionof five-sibling families is otitis prone if we assume thedisease occurs independently for different siblings in afamily?arrow_forward
arrow_back_ios
SEE MORE QUESTIONS
arrow_forward_ios
Recommended textbooks for you
 Linear Algebra: A Modern IntroductionAlgebraISBN:9781285463247Author:David PoolePublisher:Cengage Learning
 Functions and Change: A Modeling Approach to Coll...AlgebraISBN:9781337111348Author:Bruce Crauder, Benny Evans, Alan NoellPublisher:Cengage Learning
 Glencoe Algebra 1, Student Edition, 9780079039897...AlgebraISBN:9780079039897Author:CarterPublisher:McGraw Hill
 Trigonometry (MindTap Course List)TrigonometryISBN:9781337278461Author:Ron LarsonPublisher:Cengage Learning
 College AlgebraAlgebraISBN:9781305115545Author:James Stewart, Lothar Redlin, Saleem WatsonPublisher:Cengage Learning
Linear Algebra: A Modern Introduction
Algebra
ISBN:9781285463247
Author:David Poole
Publisher:Cengage Learning
Functions and Change: A Modeling Approach to Coll...
Algebra
ISBN:9781337111348
Author:Bruce Crauder, Benny Evans, Alan Noell
Publisher:Cengage Learning
Glencoe Algebra 1, Student Edition, 9780079039897...
Algebra
ISBN:9780079039897
Author:Carter
Publisher:McGraw Hill
Trigonometry (MindTap Course List)
Trigonometry
ISBN:9781337278461
Author:Ron Larson
Publisher:Cengage Learning
College Algebra
Algebra
ISBN:9781305115545
Author:James Stewart, Lothar Redlin, Saleem Watson
Publisher:Cengage Learning
01 - What Is A Differential Equation in Calculus? Learn to Solve Ordinary Differential Equations.; Author: Math and Science;https://www.youtube.com/watch?v=K80YEHQpx9g;License: Standard YouTube License, CC-BY
Higher Order Differential Equation with constant coefficient (GATE) (Part 1) l GATE 2018; Author: GATE Lectures by Dishank;https://www.youtube.com/watch?v=ODxP7BbqAjA;License: Standard YouTube License, CC-BY
Solution of Differential Equations and Initial Value Problems; Author: Jefril Amboy;https://www.youtube.com/watch?v=Q68sk7XS-dc;License: Standard YouTube License, CC-BY