
Concept explainers
Videos
Future scientists: Education professionals refer to science, technology, engineering and mathematics as the STEM disciplines. A recent ACT Condition and Career Readiness Report states that 47% of high school graduates have expressed interest in a STEM discipline. A random sample of 85 freshmen is selected.
- Is it appropriate to use the normal approximation to find the
probability that less than 45% of the freshmen in the sample have expressed interest in a STEM discipline? If so, find the probability. If not, explain why not. - A new sample of 150 freshmen is selected. Find the probability that less than of the freshmen in this sample have expressed interest in a STEM discipline.
- Find the probability that the proportion of freshmen in the sample of 150 who have expressed interest in a STEM discipline is between 0.40 and 0.45.
- Find the probability that more than 38% of the freshmen in the sample of 150 have expressed interest in a STEM discipline.
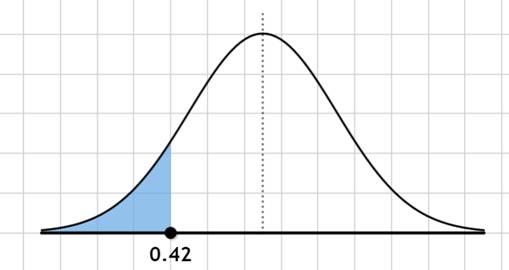
- Would it be unusual if less than 42% of the freshmen in the sample of 150 have expressed interest in a STEM discipline?
a.
To find:Whether it is appropriate to use the normal approximation to find the probability that less than 45% of freshmenhave expressed interest in a STEM discipline.
Answer to Problem 21E
It is possible to use the normal distribution. The probability that less than 45% of freshmen have expressed interest in a STEM discipline is 0.3557.
Explanation of Solution
Given information:Educational professionals refer to science, technology, engineering and mathematics as the STEM disciplines. A recent ACT Condition and Career Readiness Report states that 47% of high school graduates have expressed interest in a STEM discipline. A randomsample of 85 freshmen is selected.
Formula used:A random variable is normally distributed when
Where n is the number of sample and p is the success probability.
The mean is
The standard deviation is
Calculation:
47% of high school graduates have expressed interest in a STEM discipline and a random sample of 85 freshmen is selected. (Given)
Then
Therefore, it is possible to use thenormal distribution.
Let
The mean is
The standard deviation is
We need to find
The z-score is given by

Therefore, from the standardize normal distribution table, the area to the left of
Hence, the probability that less than 45% of freshmen have expressed interest in a STEM discipline is 0.3557.
b.
To find:The probability that less than 45% of freshmen have expressed interest in a STEM discipline.
Answer to Problem 21E
The probability less than 45% of freshmen have expressed interest in a STEM discipline is 0.3085.
Explanation of Solution
Given information: Educational professionals refer to science, technology, engineering and mathematics as the STEM disciplines. A recent ACT Condition and Career Readiness Report states that 47% of high school graduates have expressed interest in a STEM discipline. A random sample of 150 freshmen is selected.
Formula used:
The mean is
The standard deviation is
The z-score is given by
Calculation:
Let
The mean is
The standard deviation is
We need to find
The z-score is given by
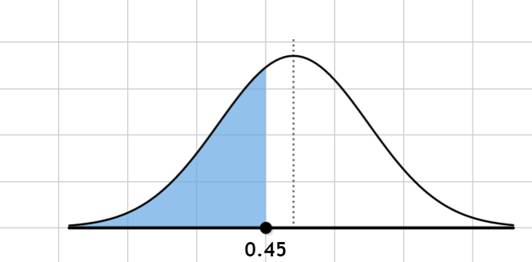
Therefore, from the standardize normal distribution table, the area to the left of
Hence, the probability that less than 45% of freshmen have expressed interest in a STEM discipline is 0.3085.
c.
To find: The probability that the sample proportion of the freshmen who have expressed interest in a STEM discipline is between 0.40 and 0.45.
Answer to Problem 21E
The probability that the sample proportion of freshmen who have expressed interest in a STEM discipline is between 0.40 and 0.45 is 0.2684.
Explanation of Solution
Given information:Educational professionals refer to science, technology, engineering and mathematics as the STEM disciplines. A recent ACT Condition and Career Readiness Report states that 47% of high school graduates have expressed interest in a STEM discipline. A random sample of 150 freshmen is selected.
Formula used:The z-score is given by
Calculation:
Let
The mean is
The standard deviation is
We need to find
The z-score is given by
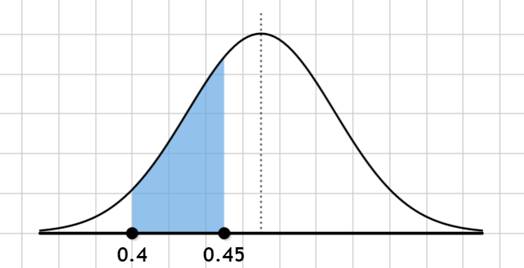
Therefore, from the standardize normal distribution table, the area to
Hence, the probability that the sample proportion of the freshmen who have expressed interest in a STEM discipline is between 0.40 and 0.45 is 0.2684.
d.
To find: The probability that more than 38% of freshmen in the sample of 150 have expressed interest in a STEM discipline.
Answer to Problem 21E
The probability that more than 38% of freshmen in the sample of 150 have expressed interest in a STEM discipline is 0.9878.
Explanation of Solution
Given information:Educational professionals refer to science, technology, engineering and mathematics as the STEM disciplines. A recent ACT Condition and Career Readiness Report states that 47% of high school graduates have expressed interest in a STEM discipline. A random sample of 150 freshmen is selected.
Formula used:The z-score is given by
Calculation:
Let
The mean is
The standard deviation is
We need to find
The z-score is given by
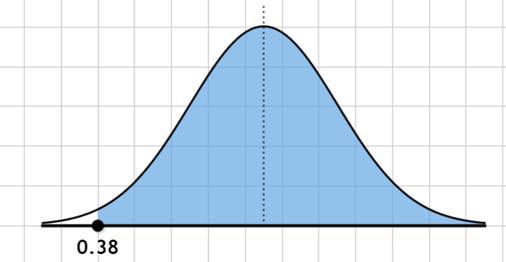
Therefore, from the standardize normal distribution table, the area to the right of
Hence, the probability that more than 38% of freshmen in the sample of 150 have expressed interest in a STEM discipline is 0.9878.
e.
To find: Whether it is unusual if less than 42% of the freshmen in the sample of 150have expressed interest in a STEM discipline.
Answer to Problem 21E
Less than 42% of the freshmen in the sample of 150have expressed interest in a STEM discipline is not unusual.
Explanation of Solution
Given information:Educational professionals refer to science, technology, engineering and mathematics as the STEM disciplines. A recent ACT Condition and Career Readiness Report states that 47% of high school graduates have expressed interest in a STEM discipline. A random sample of 150 freshmen is selected.
Formula used:The z-score is given by
Calculation:
Let
The mean is
The standard deviation is
We will compute the probability that sample proportion is less than 0.42. If the probability is less than 0.05, then the event is unusual.
We need to find
The z-score is given by
Therefore, from the standardize normal distribution table, the area to the right of
Thus, the probability that less than 42% of the freshmen in the sample of 150have expressed interest in a STEM discipline is 0.1056.
Since the probability is greater than 0.05, the given event isnot unusual.
Hence,less than 42% of the freshmen in the sample of 150have expressed interest in a STEM discipline is not unusual.
Want to see more full solutions like this?
Chapter 7 Solutions
Elementary Statistics ( 3rd International Edition ) Isbn:9781260092561


- Are the t-statistics here greater than 1.96? What do you conclude? colgPA= 1.39+0.412 hsGPA (.33) (0.094) Find the P valuearrow_forwardA poll before the elections showed that in a given sample 79% of people vote for candidate C. How many people should be interviewed so that the pollsters can be 99% sure that from 75% to 83% of the population will vote for candidate C? Round your answer to the whole number.arrow_forwardSuppose a random sample of 459 married couples found that 307 had two or more personality preferences in common. In another random sample of 471 married couples, it was found that only 31 had no preferences in common. Let p1 be the population proportion of all married couples who have two or more personality preferences in common. Let p2 be the population proportion of all married couples who have no personality preferences in common. Find a95% confidence interval for . Round your answer to three decimal places.arrow_forward
- A history teacher interviewed a random sample of 80 students about their preferences in learning activities outside of school and whether they are considering watching a historical movie at the cinema. 69 answered that they would like to go to the cinema. Let p represent the proportion of students who want to watch a historical movie. Determine the maximal margin of error. Use α = 0.05. Round your answer to three decimal places. arrow_forwardA random sample of medical files is used to estimate the proportion p of all people who have blood type B. If you have no preliminary estimate for p, how many medical files should you include in a random sample in order to be 99% sure that the point estimate will be within a distance of 0.07 from p? Round your answer to the next higher whole number.arrow_forwardA clinical study is designed to assess the average length of hospital stay of patients who underwent surgery. A preliminary study of a random sample of 70 surgery patients’ records showed that the standard deviation of the lengths of stay of all surgery patients is 7.5 days. How large should a sample to estimate the desired mean to within 1 day at 95% confidence? Round your answer to the whole number.arrow_forward
- A clinical study is designed to assess the average length of hospital stay of patients who underwent surgery. A preliminary study of a random sample of 70 surgery patients’ records showed that the standard deviation of the lengths of stay of all surgery patients is 7.5 days. How large should a sample to estimate the desired mean to within 1 day at 95% confidence? Round your answer to the whole number.arrow_forwardIn the experiment a sample of subjects is drawn of people who have an elbow surgery. Each of the people included in the sample was interviewed about their health status and measurements were taken before and after surgery. Are the measurements before and after the operation independent or dependent samples?arrow_forwardiid 1. The CLT provides an approximate sampling distribution for the arithmetic average Ỹ of a random sample Y₁, . . ., Yn f(y). The parameters of the approximate sampling distribution depend on the mean and variance of the underlying random variables (i.e., the population mean and variance). The approximation can be written to emphasize this, using the expec- tation and variance of one of the random variables in the sample instead of the parameters μ, 02: YNEY, · (1 (EY,, varyi n For the following population distributions f, write the approximate distribution of the sample mean. (a) Exponential with rate ẞ: f(y) = ß exp{−ßy} 1 (b) Chi-square with degrees of freedom: f(y) = ( 4 ) 2 y = exp { — ½/ } г( (c) Poisson with rate λ: P(Y = y) = exp(-\} > y! y²arrow_forward
- 2. Let Y₁,……., Y be a random sample with common mean μ and common variance σ². Use the CLT to write an expression approximating the CDF P(Ỹ ≤ x) in terms of µ, σ² and n, and the standard normal CDF Fz(·).arrow_forwardmatharrow_forwardCompute the median of the following data. 32, 41, 36, 42, 29, 30, 40, 22, 25, 37arrow_forward
 Holt Mcdougal Larson Pre-algebra: Student Edition...AlgebraISBN:9780547587776Author:HOLT MCDOUGALPublisher:HOLT MCDOUGAL
 Algebra and Trigonometry (MindTap Course List)AlgebraISBN:9781305071742Author:James Stewart, Lothar Redlin, Saleem WatsonPublisher:Cengage Learning
 College AlgebraAlgebraISBN:9781305115545Author:James Stewart, Lothar Redlin, Saleem WatsonPublisher:Cengage Learning