
EP FUNDAMENTALS OF STAT.-MYLAB STAT.ACC
5th Edition
ISBN: 9780135960004
Author: Sullivan
Publisher: PEARSON CO
expand_more
expand_more
format_list_bulleted
Concept explainers
Videos
Textbook Question
Chapter 7.3, Problem 5AYU
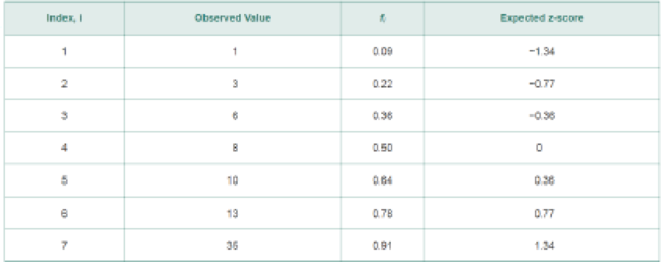
In Problems 3–6, use the results in the table to (a) draw a normal
5.
Expert Solution & Answer
Want to see the full answer?
Check out a sample textbook solution
Students have asked these similar questions
A researcher wishes to estimate, with 90% confidence, the population proportion of adults who support labeling
legislation for genetically modified organisms (GMOs). Her estimate must be accurate within 4% of the true proportion.
(a) No preliminary estimate is available. Find the minimum sample size needed.
(b) Find the minimum sample size needed, using a prior study that found that 65% of the respondents said they support
labeling legislation for GMOs.
(c) Compare the results from parts (a) and (b).
...
(a) What is the minimum sample size needed assuming that no prior information is available?
n =
(Round up to the nearest whole number as needed.)
The table available below shows the costs per mile (in cents) for a sample of automobiles. At a = 0.05, can you conclude that at least one mean
cost per mile is different from the others?
Click on the icon to view the data table.
Let Hss, HMS, HLS, Hsuv and Hмy represent the mean costs per mile for small sedans, medium sedans, large sedans, SUV 4WDs, and minivans
respectively. What are the hypotheses for this test?
OA. Ho: Not all the means are equal.
Ha Hss HMS HLS HSUV HMV
B. Ho Hss HMS HLS HSUV = μMV
Ha: Hss *HMS *HLS*HSUV * HMV
C. Ho Hss HMS HLS HSUV =μMV
= =
H: Not all the means are equal.
D. Ho Hss HMS
HLS HSUV HMV
Ha Hss HMS
HLS =HSUV = HMV
Question: A company launches two different marketing campaigns to promote the same product in two different regions. After one month, the company collects the sales data (in units sold) from both regions to compare the effectiveness of the campaigns.
The company wants to determine whether there is a significant difference in the mean sales between the two regions. Perform a two sample T-test
You can provide your answer by inserting a text box and the answer must include:
Null hypothesis,
Alternative hypothesis,
Show answer (output table/summary table), and
Conclusion based on the P value.
(2 points = 0.5 x 4 Answers)
Each of these is worth 0.5 points. However, showing the calculation is must. If calculation is missing, the whole answer won't get any credit.
Chapter 7 Solutions
EP FUNDAMENTALS OF STAT.-MYLAB STAT.ACC
Ch. 7.1 - A _____ _____ _____ is an equation used to compute...Ch. 7.1 - A _______ is an equation, table, or graph used to...Ch. 7.1 - True or False: The normal curve is symmetric about...Ch. 7.1 - The area under the normal curve to the right of ...Ch. 7.1 - The points at x = _____ and x = _____ are the...Ch. 7.1 - The area under a normal curve can be interpreted...Ch. 7.1 - For Problems 712, determine whether the graph can...Ch. 7.1 - For Problems 712, determine whether the graph can...Ch. 7.1 - For Problems 712, determine whether the graph can...Ch. 7.1 - Prob. 10AYU
Ch. 7.1 - For Problems 712, determine whether the graph can...Ch. 7.1 - For Problems 712, determine whether the graph can...Ch. 7.1 - Problems 1316 use the information presented in...Ch. 7.1 - Problems 1316 use the information presented in...Ch. 7.1 - Prob. 15AYUCh. 7.1 - Problems 1316 use the information presented in...Ch. 7.1 - Uniform Distribution The random-number generator...Ch. 7.1 - Uniform Distribution The reaction time X (in...Ch. 7.1 - In Problems 1922, determine whether or not the...Ch. 7.1 - In Problems 1922, determine whether or not the...Ch. 7.1 - In Problems 1922, determine whether or not the...Ch. 7.1 - In Problems 1922, determine whether or not the...Ch. 7.1 - One graph in the figure on the following page...Ch. 7.1 - One graph in the figure below represents a normal...Ch. 7.1 - In Problems 2528, the graph of a normal curve is...Ch. 7.1 - In Problems 2528, the graph of a normal curve is...Ch. 7.1 - Prob. 27AYUCh. 7.1 - In Problems 2528, the graph of a normal curve is...Ch. 7.1 - In Problems 29 and 30, draw a normal curve and...Ch. 7.1 - Prob. 30AYUCh. 7.1 - NW You Explain It! Cell Phone Rates Monthly...Ch. 7.1 - You Explain It! Refrigerators The lives of...Ch. 7.1 - You Explain It! Birth Weights The birth weights of...Ch. 7.1 - You Explain It! Height of 10-Year-Old Males The...Ch. 7.1 - NW You Explain It! Gestation Period The lengths of...Ch. 7.1 - Prob. 36AYUCh. 7.1 - Hitting with a Pitching Wedge In the game of golf,...Ch. 7.1 - Heights of Five-Year-Old Females The following...Ch. 7.1 - Cardiac Arrest Researchers conducted a prospective...Ch. 7.2 - A random variable Z that is normally distributed...Ch. 7.2 - The notation z is the z-score such that the area...Ch. 7.2 - If X is a normal random variable with mean 40 and...Ch. 7.2 - If X is normal random variable with mean 40 and...Ch. 7.2 - In Problems 512, find the indicated areas. For...Ch. 7.2 - In Problems 512, find the indicated areas. For...Ch. 7.2 - In Problems 512, find the indicated areas. For...Ch. 7.2 - In Problems 512, find the indicated areas. For...Ch. 7.2 - In Problems 512, find the indicated areas. For...Ch. 7.2 - In Problems 512, find the indicated areas. For...Ch. 7.2 - In Problems 512, find the indicated areas. For...Ch. 7.2 - In Problems 512, find the indicated areas. For...Ch. 7.2 - In Problems 1318, find the indicated z-score. Be...Ch. 7.2 - In Problems 1318, find the indicated z-score. Be...Ch. 7.2 - In Problems 1318, find the indicated z-score. Be...Ch. 7.2 - In Problems 1318, find the indicated z-score. Be...Ch. 7.2 - In Problems 1318, find the indicated z-score. Be...Ch. 7.2 - In Problems 1318, find the indicated z-score. Be...Ch. 7.2 - In Problems 1922, find the value of z. 19. NW...Ch. 7.2 - In Problems 1922, find the value of z. 20. z0.02Ch. 7.2 - In Problems 1922, find the value of z. 21. z0.025Ch. 7.2 - In Problems 1922, find the value of z. 22. z0.015Ch. 7.2 - In Problems 2332, assume that the random variable...Ch. 7.2 - In Problems 2332, assume that the random variable...Ch. 7.2 - In Problems 2332, assume that the random variable...Ch. 7.2 - In Problems 2332, assume that the random variable...Ch. 7.2 - In Problems 2332, assume that the random variable...Ch. 7.2 - In Problems 2332, assume that the random variable...Ch. 7.2 - In Problems 2332, assume that the random variable...Ch. 7.2 - In Problems 2332, assume that the random variable...Ch. 7.2 - In Problems 2332, assume that the random variable...Ch. 7.2 - In Problems 2332, assume that the random variable...Ch. 7.2 - In Problems 3336, assume that the random variable...Ch. 7.2 - In Problems 3336, assume that the random variable...Ch. 7.2 - In Problems 3336, assume that the random variable...Ch. 7.2 - In Problems 3336, assume that the random variable...Ch. 7.2 - Egg Incubation Times The mean incubation time of...Ch. 7.2 - Reading Rates The reading speed of sixth-grade...Ch. 7.2 - NW Chips Ahoy! Cookies The number of chocolate...Ch. 7.2 - Wendys Drive-Through Fast-food restaurants spend...Ch. 7.2 - Gestation Period The lengths of human pregnancies...Ch. 7.2 - Light Bulbs General Electric manufactures a...Ch. 7.2 - Manufacturing Steel rods are manufactured with a...Ch. 7.2 - Manufacturing Ball bearings are manufactured with...Ch. 7.2 - NCAA Basketball Point Spreads In sports betting,...Ch. 7.2 - Prob. 46AYUCh. 7.2 - NW Egg Incubation Times The mean incubation time...Ch. 7.2 - Reading Rates The reading speed of sixth-grade...Ch. 7.2 - Chips Ahoy! Cookies The number of chocolate chips...Ch. 7.2 - Wendys Drive-Through Fast-food restaurants spend...Ch. 7.2 - Speedy Lube The time required for Speedy Lube to...Ch. 7.2 - Putting It Together: Birth Weights The following...Ch. 7.2 - Prob. 53AYUCh. 7.2 - Prob. 54AYUCh. 7.2 - Explain why P(X 220) should be reported as ...Ch. 7.2 - The ACT and SAT are two college entrance exams....Ch. 7.3 - A _____ _____ _____ is a graph that plots observed...Ch. 7.3 - True or False: A normal score is the expected...Ch. 7.3 - In Problems 36, use the results in the table to...Ch. 7.3 - In Problems 36, use the results in the table to...Ch. 7.3 - In Problems 36, use the results in the table to...Ch. 7.3 - In Problems 36, use the results in the table to...Ch. 7.3 - In Problems 710, use a normal probability plot to...Ch. 7.3 - In Problems 710, use a normal probability plot to...Ch. 7.3 - In Problems 710, use a normal probability plot to...Ch. 7.3 - In Problems 710, use a normal probability plot to...Ch. 7.3 - Chips per Bag In a 1998 advertising campaign,...Ch. 7.3 - Hours of TV A random sample of college students...Ch. 7.3 - Putting It Together: Demon Roller Coaster Retrieve...Ch. 7.4 - In a binomial experiment with n trials and...Ch. 7.4 - When adding or subtracting 0.5 from X, we are...Ch. 7.4 - Suppose X is a binomial random variable. To...Ch. 7.4 - Suppose X is a binomial random variable. To...Ch. 7.4 - In Problems 514, a discrete random variable is...Ch. 7.4 - In Problems 514, a discrete random variable is...Ch. 7.4 - In Problems 514, a discrete random variable is...Ch. 7.4 - In Problems 514, a discrete random variable is...Ch. 7.4 - Prob. 9AYUCh. 7.4 - In Problems 514, a discrete random variable is...Ch. 7.4 - Prob. 11AYUCh. 7.4 - In Problems 514, a discrete random variable is...Ch. 7.4 - Prob. 13AYUCh. 7.4 - Prob. 14AYUCh. 7.4 - In Problems 1520, compute P(x) using the binomial...Ch. 7.4 - In Problems 1520, compute P(x) using the binomial...Ch. 7.4 - In Problems 1520, compute P(x) using the binomial...Ch. 7.4 - In Problems 1520, compute P(x) using the binomial...Ch. 7.4 - Prob. 19AYUCh. 7.4 - Prob. 20AYUCh. 7.4 - NW On-Time Flights According to American Airlines,...Ch. 7.4 - Prob. 22AYUCh. 7.4 - Prob. 23AYUCh. 7.4 - Sneeze According to a study done by Nick Wilson of...Ch. 7.4 - Males Living at Home According to the Current...Ch. 7.4 - Females Living at Home According to the Current...Ch. 7.4 - NW Boys Are Preferred In a Gallup poll, 37% of...Ch. 7.4 - Liars According to a USA Today Snapshot, 3% of...Ch. 7 - Use the figure to answer the questions that...Ch. 7 - In Problems 2 and 3, draw a standard normal curve...Ch. 7 - In Problems 2 and 3, draw a standard normal curve...Ch. 7 - Find the z-score such that the area to the right...Ch. 7 - Prob. 5RECh. 7 - Prob. 6RECh. 7 - Prob. 7RECh. 7 - Prob. 8RECh. 7 - Prob. 9RECh. 7 - Tire Wear Suppose that Dunlop Tire manufactures a...Ch. 7 - Wechsler Intelligence Scale The Wechsler...Ch. 7 - Major League Baseballs According to Major League...Ch. 7 - America Reads According to a Gallup poll, 46% of...Ch. 7 - Prob. 14RECh. 7 - Hector obtained a random sample of twenty recent...Ch. 7 - Density of Earth In 1798, Henry Cavendish obtained...Ch. 7 - Creative Thinking According to a USA Today...Ch. 7 - A continuous random variable X is uniformly...Ch. 7 - List the properties of the normal density curve.Ch. 7 - Prob. 20RECh. 7 - Prob. 1CTCh. 7 - Prob. 2CTCh. 7 - Prob. 3CTCh. 7 - Prob. 4CTCh. 7 - Prob. 5CTCh. 7 - Suppose that the talk time on the Apple iPhone is...Ch. 7 - The waist circumference of males 2029 years old is...Ch. 7 - Suppose the scores earned on Professor McArthurs...Ch. 7 - In a poll conducted by the Gallup organization,...Ch. 7 - Prob. 10CTCh. 7 - A continuous random variable X is uniformly...Ch. 7 - The reference interval for HDL cholesterol is...
Knowledge Booster


Learn more about
Need a deep-dive on the concept behind this application? Look no further. Learn more about this topic, statistics and related others by exploring similar questions and additional content below.Similar questions
- Binomial Prob. Question: A new teaching method claims to improve student engagement. A survey reveals that 60% of students find this method engaging. If 15 students are randomly selected, what is the probability that: a) Exactly 9 students find the method engaging?b) At least 7 students find the method engaging? (2 points = 1 x 2 answers) Provide answers in the yellow cellsarrow_forwardIn a survey of 2273 adults, 739 say they believe in UFOS. Construct a 95% confidence interval for the population proportion of adults who believe in UFOs. A 95% confidence interval for the population proportion is ( ☐, ☐ ). (Round to three decimal places as needed.)arrow_forwardFind the minimum sample size n needed to estimate μ for the given values of c, σ, and E. C=0.98, σ 6.7, and E = 2 Assume that a preliminary sample has at least 30 members. n = (Round up to the nearest whole number.)arrow_forward
- In a survey of 2193 adults in a recent year, 1233 say they have made a New Year's resolution. Construct 90% and 95% confidence intervals for the population proportion. Interpret the results and compare the widths of the confidence intervals. The 90% confidence interval for the population proportion p is (Round to three decimal places as needed.) J.D) .arrow_forwardLet p be the population proportion for the following condition. Find the point estimates for p and q. In a survey of 1143 adults from country A, 317 said that they were not confident that the food they eat in country A is safe. The point estimate for p, p, is (Round to three decimal places as needed.) ...arrow_forward(c) Because logistic regression predicts probabilities of outcomes, observations used to build a logistic regression model need not be independent. A. false: all observations must be independent B. true C. false: only observations with the same outcome need to be independent I ANSWERED: A. false: all observations must be independent. (This was marked wrong but I have no idea why. Isn't this a basic assumption of logistic regression)arrow_forward
- Business discussarrow_forwardSpam filters are built on principles similar to those used in logistic regression. We fit a probability that each message is spam or not spam. We have several variables for each email. Here are a few: to_multiple=1 if there are multiple recipients, winner=1 if the word 'winner' appears in the subject line, format=1 if the email is poorly formatted, re_subj=1 if "re" appears in the subject line. A logistic model was fit to a dataset with the following output: Estimate SE Z Pr(>|Z|) (Intercept) -0.8161 0.086 -9.4895 0 to_multiple -2.5651 0.3052 -8.4047 0 winner 1.5801 0.3156 5.0067 0 format -0.1528 0.1136 -1.3451 0.1786 re_subj -2.8401 0.363 -7.824 0 (a) Write down the model using the coefficients from the model fit.log_odds(spam) = -0.8161 + -2.5651 + to_multiple + 1.5801 winner + -0.1528 format + -2.8401 re_subj(b) Suppose we have an observation where to_multiple=0, winner=1, format=0, and re_subj=0. What is the predicted probability that this message is spam?…arrow_forwardConsider an event X comprised of three outcomes whose probabilities are 9/18, 1/18,and 6/18. Compute the probability of the complement of the event. Question content area bottom Part 1 A.1/2 B.2/18 C.16/18 D.16/3arrow_forward
- John and Mike were offered mints. What is the probability that at least John or Mike would respond favorably? (Hint: Use the classical definition.) Question content area bottom Part 1 A.1/2 B.3/4 C.1/8 D.3/8arrow_forwardThe details of the clock sales at a supermarket for the past 6 weeks are shown in the table below. The time series appears to be relatively stable, without trend, seasonal, or cyclical effects. The simple moving average value of k is set at 2. What is the simple moving average root mean square error? Round to two decimal places. Week Units sold 1 88 2 44 3 54 4 65 5 72 6 85 Question content area bottom Part 1 A. 207.13 B. 20.12 C. 14.39 D. 0.21arrow_forwardThe details of the clock sales at a supermarket for the past 6 weeks are shown in the table below. The time series appears to be relatively stable, without trend, seasonal, or cyclical effects. The simple moving average value of k is set at 2. If the smoothing constant is assumed to be 0.7, and setting F1 and F2=A1, what is the exponential smoothing sales forecast for week 7? Round to the nearest whole number. Week Units sold 1 88 2 44 3 54 4 65 5 72 6 85 Question content area bottom Part 1 A. 80 clocks B. 60 clocks C. 70 clocks D. 50 clocksarrow_forward
arrow_back_ios
SEE MORE QUESTIONS
arrow_forward_ios
Recommended textbooks for you
 Glencoe Algebra 1, Student Edition, 9780079039897...AlgebraISBN:9780079039897Author:CarterPublisher:McGraw Hill
 Functions and Change: A Modeling Approach to Coll...AlgebraISBN:9781337111348Author:Bruce Crauder, Benny Evans, Alan NoellPublisher:Cengage Learning
Glencoe Algebra 1, Student Edition, 9780079039897...
Algebra
ISBN:9780079039897
Author:Carter
Publisher:McGraw Hill
Functions and Change: A Modeling Approach to Coll...
Algebra
ISBN:9781337111348
Author:Bruce Crauder, Benny Evans, Alan Noell
Publisher:Cengage Learning
The Shape of Data: Distributions: Crash Course Statistics #7; Author: CrashCourse;https://www.youtube.com/watch?v=bPFNxD3Yg6U;License: Standard YouTube License, CC-BY
Shape, Center, and Spread - Module 20.2 (Part 1); Author: Mrmathblog;https://www.youtube.com/watch?v=COaid7O_Gag;License: Standard YouTube License, CC-BY
Shape, Center and Spread; Author: Emily Murdock;https://www.youtube.com/watch?v=_YyW0DSCzpM;License: Standard Youtube License