
EP FUNDAMENTALS OF STAT.-MYLAB STAT.ACC
5th Edition
ISBN: 9780135960004
Author: Sullivan
Publisher: PEARSON CO
expand_more
expand_more
format_list_bulleted
Concept explainers
Videos
Textbook Question
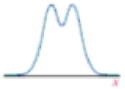
Chapter 7.1, Problem 12AYU
For Problems 7–12, determine whether the graph can represent a normal curve. If it cannot, explain why.
12. 
Expert Solution & Answer
Want to see the full answer?
Check out a sample textbook solution
Students have asked these similar questions
For each of the time series, construct a line chart of the data and identify the characteristics of the time series (that is, random, stationary, trend, seasonal, or cyclical).
Year Month Rate (%)2009 Mar 8.72009 Apr 9.02009 May 9.42009 Jun 9.52009 Jul 9.52009 Aug 9.62009 Sep 9.82009 Oct 10.02009 Nov 9.92009 Dec 9.92010 Jan 9.82010 Feb 9.82010 Mar 9.92010 Apr 9.92010 May 9.62010 Jun 9.42010 Jul 9.52010 Aug 9.52010 Sep 9.52010 Oct 9.52010 Nov 9.82010 Dec 9.32011 Jan 9.12011 Feb 9.02011 Mar 8.92011 Apr 9.02011 May 9.02011 Jun 9.12011 Jul 9.02011 Aug 9.02011 Sep 9.02011 Oct 8.92011 Nov 8.62011 Dec 8.52012 Jan 8.32012 Feb 8.32012 Mar 8.22012 Apr 8.12012 May 8.22012 Jun 8.22012 Jul 8.22012 Aug 8.12012 Sep 7.82012 Oct…
For each of the time series, construct a line chart of the data and identify the characteristics of the time series (that is, random, stationary, trend, seasonal, or cyclical).
Date IBM9/7/2010 $125.959/8/2010 $126.089/9/2010 $126.369/10/2010 $127.999/13/2010 $129.619/14/2010 $128.859/15/2010 $129.439/16/2010 $129.679/17/2010 $130.199/20/2010 $131.79
a. Construct a line chart of the closing stock prices data. Choose the correct chart below.
For each of the time series, construct a line chart of the data and identify the characteristics of the time series (that is, random, stationary, trend, seasonal, or cyclical)
Date IBM9/7/2010 $125.959/8/2010 $126.089/9/2010 $126.369/10/2010 $127.999/13/2010 $129.619/14/2010 $128.859/15/2010 $129.439/16/2010 $129.679/17/2010 $130.199/20/2010 $131.79
Chapter 7 Solutions
EP FUNDAMENTALS OF STAT.-MYLAB STAT.ACC
Ch. 7.1 - A _____ _____ _____ is an equation used to compute...Ch. 7.1 - A _______ is an equation, table, or graph used to...Ch. 7.1 - True or False: The normal curve is symmetric about...Ch. 7.1 - The area under the normal curve to the right of ...Ch. 7.1 - The points at x = _____ and x = _____ are the...Ch. 7.1 - The area under a normal curve can be interpreted...Ch. 7.1 - For Problems 712, determine whether the graph can...Ch. 7.1 - For Problems 712, determine whether the graph can...Ch. 7.1 - For Problems 712, determine whether the graph can...Ch. 7.1 - Prob. 10AYU
Ch. 7.1 - For Problems 712, determine whether the graph can...Ch. 7.1 - For Problems 712, determine whether the graph can...Ch. 7.1 - Problems 1316 use the information presented in...Ch. 7.1 - Problems 1316 use the information presented in...Ch. 7.1 - Prob. 15AYUCh. 7.1 - Problems 1316 use the information presented in...Ch. 7.1 - Uniform Distribution The random-number generator...Ch. 7.1 - Uniform Distribution The reaction time X (in...Ch. 7.1 - In Problems 1922, determine whether or not the...Ch. 7.1 - In Problems 1922, determine whether or not the...Ch. 7.1 - In Problems 1922, determine whether or not the...Ch. 7.1 - In Problems 1922, determine whether or not the...Ch. 7.1 - One graph in the figure on the following page...Ch. 7.1 - One graph in the figure below represents a normal...Ch. 7.1 - In Problems 2528, the graph of a normal curve is...Ch. 7.1 - In Problems 2528, the graph of a normal curve is...Ch. 7.1 - Prob. 27AYUCh. 7.1 - In Problems 2528, the graph of a normal curve is...Ch. 7.1 - In Problems 29 and 30, draw a normal curve and...Ch. 7.1 - Prob. 30AYUCh. 7.1 - NW You Explain It! Cell Phone Rates Monthly...Ch. 7.1 - You Explain It! Refrigerators The lives of...Ch. 7.1 - You Explain It! Birth Weights The birth weights of...Ch. 7.1 - You Explain It! Height of 10-Year-Old Males The...Ch. 7.1 - NW You Explain It! Gestation Period The lengths of...Ch. 7.1 - Prob. 36AYUCh. 7.1 - Hitting with a Pitching Wedge In the game of golf,...Ch. 7.1 - Heights of Five-Year-Old Females The following...Ch. 7.1 - Cardiac Arrest Researchers conducted a prospective...Ch. 7.2 - A random variable Z that is normally distributed...Ch. 7.2 - The notation z is the z-score such that the area...Ch. 7.2 - If X is a normal random variable with mean 40 and...Ch. 7.2 - If X is normal random variable with mean 40 and...Ch. 7.2 - In Problems 512, find the indicated areas. For...Ch. 7.2 - In Problems 512, find the indicated areas. For...Ch. 7.2 - In Problems 512, find the indicated areas. For...Ch. 7.2 - In Problems 512, find the indicated areas. For...Ch. 7.2 - In Problems 512, find the indicated areas. For...Ch. 7.2 - In Problems 512, find the indicated areas. For...Ch. 7.2 - In Problems 512, find the indicated areas. For...Ch. 7.2 - In Problems 512, find the indicated areas. For...Ch. 7.2 - In Problems 1318, find the indicated z-score. Be...Ch. 7.2 - In Problems 1318, find the indicated z-score. Be...Ch. 7.2 - In Problems 1318, find the indicated z-score. Be...Ch. 7.2 - In Problems 1318, find the indicated z-score. Be...Ch. 7.2 - In Problems 1318, find the indicated z-score. Be...Ch. 7.2 - In Problems 1318, find the indicated z-score. Be...Ch. 7.2 - In Problems 1922, find the value of z. 19. NW...Ch. 7.2 - In Problems 1922, find the value of z. 20. z0.02Ch. 7.2 - In Problems 1922, find the value of z. 21. z0.025Ch. 7.2 - In Problems 1922, find the value of z. 22. z0.015Ch. 7.2 - In Problems 2332, assume that the random variable...Ch. 7.2 - In Problems 2332, assume that the random variable...Ch. 7.2 - In Problems 2332, assume that the random variable...Ch. 7.2 - In Problems 2332, assume that the random variable...Ch. 7.2 - In Problems 2332, assume that the random variable...Ch. 7.2 - In Problems 2332, assume that the random variable...Ch. 7.2 - In Problems 2332, assume that the random variable...Ch. 7.2 - In Problems 2332, assume that the random variable...Ch. 7.2 - In Problems 2332, assume that the random variable...Ch. 7.2 - In Problems 2332, assume that the random variable...Ch. 7.2 - In Problems 3336, assume that the random variable...Ch. 7.2 - In Problems 3336, assume that the random variable...Ch. 7.2 - In Problems 3336, assume that the random variable...Ch. 7.2 - In Problems 3336, assume that the random variable...Ch. 7.2 - Egg Incubation Times The mean incubation time of...Ch. 7.2 - Reading Rates The reading speed of sixth-grade...Ch. 7.2 - NW Chips Ahoy! Cookies The number of chocolate...Ch. 7.2 - Wendys Drive-Through Fast-food restaurants spend...Ch. 7.2 - Gestation Period The lengths of human pregnancies...Ch. 7.2 - Light Bulbs General Electric manufactures a...Ch. 7.2 - Manufacturing Steel rods are manufactured with a...Ch. 7.2 - Manufacturing Ball bearings are manufactured with...Ch. 7.2 - NCAA Basketball Point Spreads In sports betting,...Ch. 7.2 - Prob. 46AYUCh. 7.2 - NW Egg Incubation Times The mean incubation time...Ch. 7.2 - Reading Rates The reading speed of sixth-grade...Ch. 7.2 - Chips Ahoy! Cookies The number of chocolate chips...Ch. 7.2 - Wendys Drive-Through Fast-food restaurants spend...Ch. 7.2 - Speedy Lube The time required for Speedy Lube to...Ch. 7.2 - Putting It Together: Birth Weights The following...Ch. 7.2 - Prob. 53AYUCh. 7.2 - Prob. 54AYUCh. 7.2 - Explain why P(X 220) should be reported as ...Ch. 7.2 - The ACT and SAT are two college entrance exams....Ch. 7.3 - A _____ _____ _____ is a graph that plots observed...Ch. 7.3 - True or False: A normal score is the expected...Ch. 7.3 - In Problems 36, use the results in the table to...Ch. 7.3 - In Problems 36, use the results in the table to...Ch. 7.3 - In Problems 36, use the results in the table to...Ch. 7.3 - In Problems 36, use the results in the table to...Ch. 7.3 - In Problems 710, use a normal probability plot to...Ch. 7.3 - In Problems 710, use a normal probability plot to...Ch. 7.3 - In Problems 710, use a normal probability plot to...Ch. 7.3 - In Problems 710, use a normal probability plot to...Ch. 7.3 - Chips per Bag In a 1998 advertising campaign,...Ch. 7.3 - Hours of TV A random sample of college students...Ch. 7.3 - Putting It Together: Demon Roller Coaster Retrieve...Ch. 7.4 - In a binomial experiment with n trials and...Ch. 7.4 - When adding or subtracting 0.5 from X, we are...Ch. 7.4 - Suppose X is a binomial random variable. To...Ch. 7.4 - Suppose X is a binomial random variable. To...Ch. 7.4 - In Problems 514, a discrete random variable is...Ch. 7.4 - In Problems 514, a discrete random variable is...Ch. 7.4 - In Problems 514, a discrete random variable is...Ch. 7.4 - In Problems 514, a discrete random variable is...Ch. 7.4 - Prob. 9AYUCh. 7.4 - In Problems 514, a discrete random variable is...Ch. 7.4 - Prob. 11AYUCh. 7.4 - In Problems 514, a discrete random variable is...Ch. 7.4 - Prob. 13AYUCh. 7.4 - Prob. 14AYUCh. 7.4 - In Problems 1520, compute P(x) using the binomial...Ch. 7.4 - In Problems 1520, compute P(x) using the binomial...Ch. 7.4 - In Problems 1520, compute P(x) using the binomial...Ch. 7.4 - In Problems 1520, compute P(x) using the binomial...Ch. 7.4 - Prob. 19AYUCh. 7.4 - Prob. 20AYUCh. 7.4 - NW On-Time Flights According to American Airlines,...Ch. 7.4 - Prob. 22AYUCh. 7.4 - Prob. 23AYUCh. 7.4 - Sneeze According to a study done by Nick Wilson of...Ch. 7.4 - Males Living at Home According to the Current...Ch. 7.4 - Females Living at Home According to the Current...Ch. 7.4 - NW Boys Are Preferred In a Gallup poll, 37% of...Ch. 7.4 - Liars According to a USA Today Snapshot, 3% of...Ch. 7 - Use the figure to answer the questions that...Ch. 7 - In Problems 2 and 3, draw a standard normal curve...Ch. 7 - In Problems 2 and 3, draw a standard normal curve...Ch. 7 - Find the z-score such that the area to the right...Ch. 7 - Prob. 5RECh. 7 - Prob. 6RECh. 7 - Prob. 7RECh. 7 - Prob. 8RECh. 7 - Prob. 9RECh. 7 - Tire Wear Suppose that Dunlop Tire manufactures a...Ch. 7 - Wechsler Intelligence Scale The Wechsler...Ch. 7 - Major League Baseballs According to Major League...Ch. 7 - America Reads According to a Gallup poll, 46% of...Ch. 7 - Prob. 14RECh. 7 - Hector obtained a random sample of twenty recent...Ch. 7 - Density of Earth In 1798, Henry Cavendish obtained...Ch. 7 - Creative Thinking According to a USA Today...Ch. 7 - A continuous random variable X is uniformly...Ch. 7 - List the properties of the normal density curve.Ch. 7 - Prob. 20RECh. 7 - Prob. 1CTCh. 7 - Prob. 2CTCh. 7 - Prob. 3CTCh. 7 - Prob. 4CTCh. 7 - Prob. 5CTCh. 7 - Suppose that the talk time on the Apple iPhone is...Ch. 7 - The waist circumference of males 2029 years old is...Ch. 7 - Suppose the scores earned on Professor McArthurs...Ch. 7 - In a poll conducted by the Gallup organization,...Ch. 7 - Prob. 10CTCh. 7 - A continuous random variable X is uniformly...Ch. 7 - The reference interval for HDL cholesterol is...
Knowledge Booster


Learn more about
Need a deep-dive on the concept behind this application? Look no further. Learn more about this topic, statistics and related others by exploring similar questions and additional content below.Similar questions
- 1. A consumer group claims that the mean annual consumption of cheddar cheese by a person in the United States is at most 10.3 pounds. A random sample of 100 people in the United States has a mean annual cheddar cheese consumption of 9.9 pounds. Assume the population standard deviation is 2.1 pounds. At a = 0.05, can you reject the claim? (Adapted from U.S. Department of Agriculture) State the hypotheses: Calculate the test statistic: Calculate the P-value: Conclusion (reject or fail to reject Ho): 2. The CEO of a manufacturing facility claims that the mean workday of the company's assembly line employees is less than 8.5 hours. A random sample of 25 of the company's assembly line employees has a mean workday of 8.2 hours. Assume the population standard deviation is 0.5 hour and the population is normally distributed. At a = 0.01, test the CEO's claim. State the hypotheses: Calculate the test statistic: Calculate the P-value: Conclusion (reject or fail to reject Ho): Statisticsarrow_forward21. find the mean. and variance of the following: Ⓒ x(t) = Ut +V, and V indepriv. s.t U.VN NL0, 63). X(t) = t² + Ut +V, U and V incepires have N (0,8) Ut ①xt = e UNN (0162) ~ X+ = UCOSTE, UNNL0, 62) SU, Oct ⑤Xt= 7 where U. Vindp.rus +> ½ have NL, 62). ⑥Xn = ΣY, 41, 42, 43, ... Yn vandom sample K=1 Text with mean zen and variance 6arrow_forwardA psychology researcher conducted a Chi-Square Test of Independence to examine whether there is a relationship between college students’ year in school (Freshman, Sophomore, Junior, Senior) and their preferred coping strategy for academic stress (Problem-Focused, Emotion-Focused, Avoidance). The test yielded the following result: image.png Interpret the results of this analysis. In your response, clearly explain: Whether the result is statistically significant and why. What this means about the relationship between year in school and coping strategy. What the researcher should conclude based on these findings.arrow_forward
- A school counselor is conducting a research study to examine whether there is a relationship between the number of times teenagers report vaping per week and their academic performance, measured by GPA. The counselor collects data from a sample of high school students. Write the null and alternative hypotheses for this study. Clearly state your hypotheses in terms of the correlation between vaping frequency and academic performance. EditViewInsertFormatToolsTable 12pt Paragrapharrow_forwardA smallish urn contains 25 small plastic bunnies – 7 of which are pink and 18 of which are white. 10 bunnies are drawn from the urn at random with replacement, and X is the number of pink bunnies that are drawn. (a) P(X = 5) ≈ (b) P(X<6) ≈ The Whoville small urn contains 100 marbles – 60 blue and 40 orange. The Grinch sneaks in one night and grabs a simple random sample (without replacement) of 15 marbles. (a) The probability that the Grinch gets exactly 6 blue marbles is [ Select ] ["≈ 0.054", "≈ 0.043", "≈ 0.061"] . (b) The probability that the Grinch gets at least 7 blue marbles is [ Select ] ["≈ 0.922", "≈ 0.905", "≈ 0.893"] . (c) The probability that the Grinch gets between 8 and 12 blue marbles (inclusive) is [ Select ] ["≈ 0.801", "≈ 0.760", "≈ 0.786"] . The Whoville small urn contains 100 marbles – 60 blue and 40 orange. The Grinch sneaks in one night and grabs a simple random sample (without replacement) of 15 marbles. (a)…arrow_forwardSuppose an experiment was conducted to compare the mileage(km) per litre obtained by competing brands of petrol I,II,III. Three new Mazda, three new Toyota and three new Nissan cars were available for experimentation. During the experiment the cars would operate under same conditions in order to eliminate the effect of external variables on the distance travelled per litre on the assigned brand of petrol. The data is given as below: Brands of Petrol Mazda Toyota Nissan I 10.6 12.0 11.0 II 9.0 15.0 12.0 III 12.0 17.4 13.0 (a) Test at the 5% level of significance whether there are signi cant differences among the brands of fuels and also among the cars. [10] (b) Compute the standard error for comparing any two fuel brands means. Hence compare, at the 5% level of significance, each of fuel brands II, and III with the standard fuel brand I. [10] �arrow_forward
- Analyze the residuals of a linear regression model and select the best response. yes, the residual plot does not show a curve no, the residual plot shows a curve yes, the residual plot shows a curve no, the residual plot does not show a curve I answered, "No, the residual plot shows a curve." (and this was incorrect). I am not sure why I keep getting these wrong when the answer seems obvious. Please help me understand what the yes and no references in the answer.arrow_forwarda. Find the value of A.b. Find pX(x) and py(y).c. Find pX|y(x|y) and py|X(y|x)d. Are x and y independent? Why or why not?arrow_forwardAnalyze the residuals of a linear regression model and select the best response.Criteria is simple evaluation of possible indications of an exponential model vs. linear model) no, the residual plot does not show a curve yes, the residual plot does not show a curve yes, the residual plot shows a curve no, the residual plot shows a curve I selected: yes, the residual plot shows a curve and it is INCORRECT. Can u help me understand why?arrow_forward
arrow_back_ios
SEE MORE QUESTIONS
arrow_forward_ios
Recommended textbooks for you
 Glencoe Algebra 1, Student Edition, 9780079039897...AlgebraISBN:9780079039897Author:CarterPublisher:McGraw Hill
Glencoe Algebra 1, Student Edition, 9780079039897...
Algebra
ISBN:9780079039897
Author:Carter
Publisher:McGraw Hill
The Shape of Data: Distributions: Crash Course Statistics #7; Author: CrashCourse;https://www.youtube.com/watch?v=bPFNxD3Yg6U;License: Standard YouTube License, CC-BY
Shape, Center, and Spread - Module 20.2 (Part 1); Author: Mrmathblog;https://www.youtube.com/watch?v=COaid7O_Gag;License: Standard YouTube License, CC-BY
Shape, Center and Spread; Author: Emily Murdock;https://www.youtube.com/watch?v=_YyW0DSCzpM;License: Standard Youtube License