
Fundamentals of Statistics (5th Edition)
5th Edition
ISBN: 9780134508306
Author: Michael Sullivan III
Publisher: PEARSON
expand_more
expand_more
format_list_bulleted
Concept explainers
Videos
Textbook Question
Chapter 7.3, Problem 4AYU
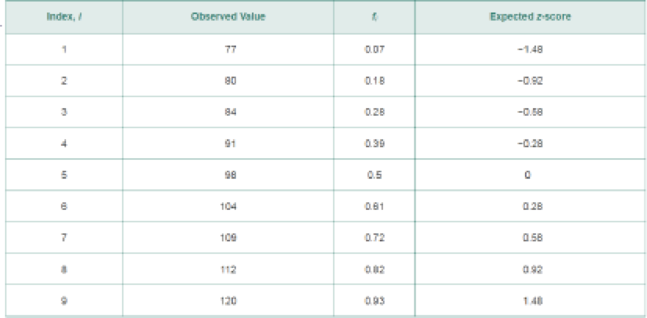
In Problems 3–6, use the results in the table to (a) draw a normal
4. 
Expert Solution & Answer
Want to see the full answer?
Check out a sample textbook solution
Students have asked these similar questions
Test the claim that a student's pulse rate is different when taking a quiz than attending a regular class. The mean pulse rate difference is 2.7 with 10 students. Use a significance level of 0.005.
Pulse rate difference(Quiz - Lecture)
2
-1
5
-8
1
20
15
-4
9
-12
The following ordered data list shows the data speeds for cell phones used by a
telephone company at an airport:
A. Calculate the Measures of Central Tendency from the ungrouped data list.
B. Group the data in an appropriate frequency table.
C. Calculate the Measures of Central Tendency using the table in point B.
D. Are there differences in the measurements obtained in A and C? Why (give at
least one justified reason)?
I leave the answers to A and B to resolve the remaining two.
0.8
1.4
1.8
1.9
3.2
3.6
4.5
4.5
4.6
6.2
6.5
7.7
7.9
9.9
10.2
10.3
10.9
11.1
11.1
11.6
11.8
12.0
13.1
13.5
13.7
14.1
14.2
14.7
15.0
15.1
15.5
15.8
16.0
17.5
18.2
20.2
21.1
21.5
22.2
22.4
23.1
24.5
25.7
28.5
34.6
38.5
43.0
55.6
71.3
77.8
A. Measures of Central Tendency
We are to calculate:
Mean, Median, Mode
The data (already ordered) is:
0.8, 1.4, 1.8, 1.9, 3.2, 3.6, 4.5, 4.5, 4.6, 6.2, 6.5, 7.7, 7.9, 9.9, 10.2, 10.3, 10.9,
11.1, 11.1, 11.6,
11.8, 12.0, 13.1, 13.5, 13.7, 14.1, 14.2, 14.7, 15.0, 15.1, 15.5,…
PEER REPLY 1:
Choose a classmate's Main Post.
1. Indicate a range of values for the independent variable (x) that is reasonable
based on the data provided.
2. Explain what the predicted range of dependent values should be based on
the range of independent values.
Chapter 7 Solutions
Fundamentals of Statistics (5th Edition)
Ch. 7.1 - A _____ _____ _____ is an equation used to compute...Ch. 7.1 - A _______ is an equation, table, or graph used to...Ch. 7.1 - True or False: The normal curve is symmetric about...Ch. 7.1 - The area under the normal curve to the right of ...Ch. 7.1 - The points at x = _____ and x = _____ are the...Ch. 7.1 - The area under a normal curve can be interpreted...Ch. 7.1 - For Problems 712, determine whether the graph can...Ch. 7.1 - For Problems 712, determine whether the graph can...Ch. 7.1 - For Problems 712, determine whether the graph can...Ch. 7.1 - Prob. 10AYU
Ch. 7.1 - For Problems 712, determine whether the graph can...Ch. 7.1 - For Problems 712, determine whether the graph can...Ch. 7.1 - Problems 1316 use the information presented in...Ch. 7.1 - Problems 1316 use the information presented in...Ch. 7.1 - Prob. 15AYUCh. 7.1 - Problems 1316 use the information presented in...Ch. 7.1 - Uniform Distribution The random-number generator...Ch. 7.1 - Uniform Distribution The reaction time X (in...Ch. 7.1 - In Problems 1922, determine whether or not the...Ch. 7.1 - In Problems 1922, determine whether or not the...Ch. 7.1 - In Problems 1922, determine whether or not the...Ch. 7.1 - In Problems 1922, determine whether or not the...Ch. 7.1 - One graph in the figure on the following page...Ch. 7.1 - One graph in the figure below represents a normal...Ch. 7.1 - In Problems 2528, the graph of a normal curve is...Ch. 7.1 - In Problems 2528, the graph of a normal curve is...Ch. 7.1 - Prob. 27AYUCh. 7.1 - In Problems 2528, the graph of a normal curve is...Ch. 7.1 - In Problems 29 and 30, draw a normal curve and...Ch. 7.1 - Prob. 30AYUCh. 7.1 - NW You Explain It! Cell Phone Rates Monthly...Ch. 7.1 - You Explain It! Refrigerators The lives of...Ch. 7.1 - You Explain It! Birth Weights The birth weights of...Ch. 7.1 - You Explain It! Height of 10-Year-Old Males The...Ch. 7.1 - NW You Explain It! Gestation Period The lengths of...Ch. 7.1 - Prob. 36AYUCh. 7.1 - Hitting with a Pitching Wedge In the game of golf,...Ch. 7.1 - Heights of Five-Year-Old Females The following...Ch. 7.1 - Cardiac Arrest Researchers conducted a prospective...Ch. 7.2 - A random variable Z that is normally distributed...Ch. 7.2 - The notation z is the z-score such that the area...Ch. 7.2 - If X is a normal random variable with mean 40 and...Ch. 7.2 - If X is normal random variable with mean 40 and...Ch. 7.2 - In Problems 512, find the indicated areas. For...Ch. 7.2 - In Problems 512, find the indicated areas. For...Ch. 7.2 - In Problems 512, find the indicated areas. For...Ch. 7.2 - In Problems 512, find the indicated areas. For...Ch. 7.2 - In Problems 512, find the indicated areas. For...Ch. 7.2 - In Problems 512, find the indicated areas. For...Ch. 7.2 - In Problems 512, find the indicated areas. For...Ch. 7.2 - In Problems 512, find the indicated areas. For...Ch. 7.2 - In Problems 1318, find the indicated z-score. Be...Ch. 7.2 - In Problems 1318, find the indicated z-score. Be...Ch. 7.2 - In Problems 1318, find the indicated z-score. Be...Ch. 7.2 - In Problems 1318, find the indicated z-score. Be...Ch. 7.2 - In Problems 1318, find the indicated z-score. Be...Ch. 7.2 - In Problems 1318, find the indicated z-score. Be...Ch. 7.2 - In Problems 1922, find the value of z. 19. NW...Ch. 7.2 - In Problems 1922, find the value of z. 20. z0.02Ch. 7.2 - In Problems 1922, find the value of z. 21. z0.025Ch. 7.2 - In Problems 1922, find the value of z. 22. z0.015Ch. 7.2 - In Problems 2332, assume that the random variable...Ch. 7.2 - In Problems 2332, assume that the random variable...Ch. 7.2 - In Problems 2332, assume that the random variable...Ch. 7.2 - In Problems 2332, assume that the random variable...Ch. 7.2 - In Problems 2332, assume that the random variable...Ch. 7.2 - In Problems 2332, assume that the random variable...Ch. 7.2 - In Problems 2332, assume that the random variable...Ch. 7.2 - In Problems 2332, assume that the random variable...Ch. 7.2 - In Problems 2332, assume that the random variable...Ch. 7.2 - In Problems 2332, assume that the random variable...Ch. 7.2 - In Problems 3336, assume that the random variable...Ch. 7.2 - In Problems 3336, assume that the random variable...Ch. 7.2 - In Problems 3336, assume that the random variable...Ch. 7.2 - In Problems 3336, assume that the random variable...Ch. 7.2 - Egg Incubation Times The mean incubation time of...Ch. 7.2 - Reading Rates The reading speed of sixth-grade...Ch. 7.2 - NW Chips Ahoy! Cookies The number of chocolate...Ch. 7.2 - Wendys Drive-Through Fast-food restaurants spend...Ch. 7.2 - Gestation Period The lengths of human pregnancies...Ch. 7.2 - Light Bulbs General Electric manufactures a...Ch. 7.2 - Manufacturing Steel rods are manufactured with a...Ch. 7.2 - Manufacturing Ball bearings are manufactured with...Ch. 7.2 - NCAA Basketball Point Spreads In sports betting,...Ch. 7.2 - Prob. 46AYUCh. 7.2 - NW Egg Incubation Times The mean incubation time...Ch. 7.2 - Reading Rates The reading speed of sixth-grade...Ch. 7.2 - Chips Ahoy! Cookies The number of chocolate chips...Ch. 7.2 - Wendys Drive-Through Fast-food restaurants spend...Ch. 7.2 - Speedy Lube The time required for Speedy Lube to...Ch. 7.2 - Putting It Together: Birth Weights The following...Ch. 7.2 - Prob. 53AYUCh. 7.2 - Prob. 54AYUCh. 7.2 - Explain why P(X 220) should be reported as ...Ch. 7.2 - The ACT and SAT are two college entrance exams....Ch. 7.3 - A _____ _____ _____ is a graph that plots observed...Ch. 7.3 - True or False: A normal score is the expected...Ch. 7.3 - In Problems 36, use the results in the table to...Ch. 7.3 - In Problems 36, use the results in the table to...Ch. 7.3 - In Problems 36, use the results in the table to...Ch. 7.3 - In Problems 36, use the results in the table to...Ch. 7.3 - In Problems 710, use a normal probability plot to...Ch. 7.3 - In Problems 710, use a normal probability plot to...Ch. 7.3 - In Problems 710, use a normal probability plot to...Ch. 7.3 - In Problems 710, use a normal probability plot to...Ch. 7.3 - Chips per Bag In a 1998 advertising campaign,...Ch. 7.3 - Hours of TV A random sample of college students...Ch. 7.3 - Putting It Together: Demon Roller Coaster Retrieve...Ch. 7.4 - In a binomial experiment with n trials and...Ch. 7.4 - When adding or subtracting 0.5 from X, we are...Ch. 7.4 - Suppose X is a binomial random variable. To...Ch. 7.4 - Suppose X is a binomial random variable. To...Ch. 7.4 - In Problems 514, a discrete random variable is...Ch. 7.4 - In Problems 514, a discrete random variable is...Ch. 7.4 - In Problems 514, a discrete random variable is...Ch. 7.4 - In Problems 514, a discrete random variable is...Ch. 7.4 - Prob. 9AYUCh. 7.4 - In Problems 514, a discrete random variable is...Ch. 7.4 - Prob. 11AYUCh. 7.4 - In Problems 514, a discrete random variable is...Ch. 7.4 - Prob. 13AYUCh. 7.4 - Prob. 14AYUCh. 7.4 - In Problems 1520, compute P(x) using the binomial...Ch. 7.4 - In Problems 1520, compute P(x) using the binomial...Ch. 7.4 - In Problems 1520, compute P(x) using the binomial...Ch. 7.4 - In Problems 1520, compute P(x) using the binomial...Ch. 7.4 - Prob. 19AYUCh. 7.4 - Prob. 20AYUCh. 7.4 - NW On-Time Flights According to American Airlines,...Ch. 7.4 - Prob. 22AYUCh. 7.4 - Prob. 23AYUCh. 7.4 - Sneeze According to a study done by Nick Wilson of...Ch. 7.4 - Males Living at Home According to the Current...Ch. 7.4 - Females Living at Home According to the Current...Ch. 7.4 - NW Boys Are Preferred In a Gallup poll, 37% of...Ch. 7.4 - Liars According to a USA Today Snapshot, 3% of...Ch. 7 - Use the figure to answer the questions that...Ch. 7 - In Problems 2 and 3, draw a standard normal curve...Ch. 7 - In Problems 2 and 3, draw a standard normal curve...Ch. 7 - Find the z-score such that the area to the right...Ch. 7 - Prob. 5RECh. 7 - Prob. 6RECh. 7 - Prob. 7RECh. 7 - Prob. 8RECh. 7 - Prob. 9RECh. 7 - Tire Wear Suppose that Dunlop Tire manufactures a...Ch. 7 - Wechsler Intelligence Scale The Wechsler...Ch. 7 - Major League Baseballs According to Major League...Ch. 7 - America Reads According to a Gallup poll, 46% of...Ch. 7 - Prob. 14RECh. 7 - Hector obtained a random sample of twenty recent...Ch. 7 - Density of Earth In 1798, Henry Cavendish obtained...Ch. 7 - Creative Thinking According to a USA Today...Ch. 7 - A continuous random variable X is uniformly...Ch. 7 - List the properties of the normal density curve.Ch. 7 - Prob. 20RECh. 7 - Prob. 1CTCh. 7 - Prob. 2CTCh. 7 - Prob. 3CTCh. 7 - Prob. 4CTCh. 7 - Prob. 5CTCh. 7 - Suppose that the talk time on the Apple iPhone is...Ch. 7 - The waist circumference of males 2029 years old is...Ch. 7 - Suppose the scores earned on Professor McArthurs...Ch. 7 - In a poll conducted by the Gallup organization,...Ch. 7 - Prob. 10CTCh. 7 - A continuous random variable X is uniformly...Ch. 7 - The reference interval for HDL cholesterol is...
Knowledge Booster


Learn more about
Need a deep-dive on the concept behind this application? Look no further. Learn more about this topic, statistics and related others by exploring similar questions and additional content below.Similar questions
- In a company with 80 employees, 60 earn $10.00 per hour and 20 earn $13.00 per hour. Is this average hourly wage considered representative?arrow_forwardThe following is a list of questions answered correctly on an exam. Calculate the Measures of Central Tendency from the ungrouped data list. NUMBER OF QUESTIONS ANSWERED CORRECTLY ON AN APTITUDE EXAM 112 72 69 97 107 73 92 76 86 73 126 128 118 127 124 82 104 132 134 83 92 108 96 100 92 115 76 91 102 81 95 141 81 80 106 84 119 113 98 75 68 98 115 106 95 100 85 94 106 119arrow_forwardThe following ordered data list shows the data speeds for cell phones used by a telephone company at an airport: A. Calculate the Measures of Central Tendency using the table in point B. B. Are there differences in the measurements obtained in A and C? Why (give at least one justified reason)? 0.8 1.4 1.8 1.9 3.2 3.6 4.5 4.5 4.6 6.2 6.5 7.7 7.9 9.9 10.2 10.3 10.9 11.1 11.1 11.6 11.8 12.0 13.1 13.5 13.7 14.1 14.2 14.7 15.0 15.1 15.5 15.8 16.0 17.5 18.2 20.2 21.1 21.5 22.2 22.4 23.1 24.5 25.7 28.5 34.6 38.5 43.0 55.6 71.3 77.8arrow_forward
- In a company with 80 employees, 60 earn $10.00 per hour and 20 earn $13.00 per hour. a) Determine the average hourly wage. b) In part a), is the same answer obtained if the 60 employees have an average wage of $10.00 per hour? Prove your answer.arrow_forwardThe following ordered data list shows the data speeds for cell phones used by a telephone company at an airport: A. Calculate the Measures of Central Tendency from the ungrouped data list. B. Group the data in an appropriate frequency table. 0.8 1.4 1.8 1.9 3.2 3.6 4.5 4.5 4.6 6.2 6.5 7.7 7.9 9.9 10.2 10.3 10.9 11.1 11.1 11.6 11.8 12.0 13.1 13.5 13.7 14.1 14.2 14.7 15.0 15.1 15.5 15.8 16.0 17.5 18.2 20.2 21.1 21.5 22.2 22.4 23.1 24.5 25.7 28.5 34.6 38.5 43.0 55.6 71.3 77.8arrow_forwardBusinessarrow_forward
- https://www.hawkeslearning.com/Statistics/dbs2/datasets.htmlarrow_forwardNC Current Students - North Ce X | NC Canvas Login Links - North ( X Final Exam Comprehensive x Cengage Learning x WASTAT - Final Exam - STAT → C webassign.net/web/Student/Assignment-Responses/submit?dep=36055360&tags=autosave#question3659890_9 Part (b) Draw a scatter plot of the ordered pairs. N Life Expectancy Life Expectancy 80 70 600 50 40 30 20 10 Year of 1950 1970 1990 2010 Birth O Life Expectancy Part (c) 800 70 60 50 40 30 20 10 1950 1970 1990 W ALT 林 $ # 4 R J7 Year of 2010 Birth F6 4+ 80 70 60 50 40 30 20 10 Year of 1950 1970 1990 2010 Birth Life Expectancy Ox 800 70 60 50 40 30 20 10 Year of 1950 1970 1990 2010 Birth hp P.B. KA & 7 80 % 5 H A B F10 711 N M K 744 PRT SC ALT CTRLarrow_forwardHarvard University California Institute of Technology Massachusetts Institute of Technology Stanford University Princeton University University of Cambridge University of Oxford University of California, Berkeley Imperial College London Yale University University of California, Los Angeles University of Chicago Johns Hopkins University Cornell University ETH Zurich University of Michigan University of Toronto Columbia University University of Pennsylvania Carnegie Mellon University University of Hong Kong University College London University of Washington Duke University Northwestern University University of Tokyo Georgia Institute of Technology Pohang University of Science and Technology University of California, Santa Barbara University of British Columbia University of North Carolina at Chapel Hill University of California, San Diego University of Illinois at Urbana-Champaign National University of Singapore McGill…arrow_forward
- Name Harvard University California Institute of Technology Massachusetts Institute of Technology Stanford University Princeton University University of Cambridge University of Oxford University of California, Berkeley Imperial College London Yale University University of California, Los Angeles University of Chicago Johns Hopkins University Cornell University ETH Zurich University of Michigan University of Toronto Columbia University University of Pennsylvania Carnegie Mellon University University of Hong Kong University College London University of Washington Duke University Northwestern University University of Tokyo Georgia Institute of Technology Pohang University of Science and Technology University of California, Santa Barbara University of British Columbia University of North Carolina at Chapel Hill University of California, San Diego University of Illinois at Urbana-Champaign National University of Singapore…arrow_forwardA company found that the daily sales revenue of its flagship product follows a normal distribution with a mean of $4500 and a standard deviation of $450. The company defines a "high-sales day" that is, any day with sales exceeding $4800. please provide a step by step on how to get the answers in excel Q: What percentage of days can the company expect to have "high-sales days" or sales greater than $4800? Q: What is the sales revenue threshold for the bottom 10% of days? (please note that 10% refers to the probability/area under bell curve towards the lower tail of bell curve) Provide answers in the yellow cellsarrow_forwardFind the critical value for a left-tailed test using the F distribution with a 0.025, degrees of freedom in the numerator=12, and degrees of freedom in the denominator = 50. A portion of the table of critical values of the F-distribution is provided. Click the icon to view the partial table of critical values of the F-distribution. What is the critical value? (Round to two decimal places as needed.)arrow_forward
arrow_back_ios
SEE MORE QUESTIONS
arrow_forward_ios
Recommended textbooks for you
 Glencoe Algebra 1, Student Edition, 9780079039897...AlgebraISBN:9780079039897Author:CarterPublisher:McGraw Hill
 Functions and Change: A Modeling Approach to Coll...AlgebraISBN:9781337111348Author:Bruce Crauder, Benny Evans, Alan NoellPublisher:Cengage Learning
Glencoe Algebra 1, Student Edition, 9780079039897...
Algebra
ISBN:9780079039897
Author:Carter
Publisher:McGraw Hill
Functions and Change: A Modeling Approach to Coll...
Algebra
ISBN:9781337111348
Author:Bruce Crauder, Benny Evans, Alan Noell
Publisher:Cengage Learning
The Shape of Data: Distributions: Crash Course Statistics #7; Author: CrashCourse;https://www.youtube.com/watch?v=bPFNxD3Yg6U;License: Standard YouTube License, CC-BY
Shape, Center, and Spread - Module 20.2 (Part 1); Author: Mrmathblog;https://www.youtube.com/watch?v=COaid7O_Gag;License: Standard YouTube License, CC-BY
Shape, Center and Spread; Author: Emily Murdock;https://www.youtube.com/watch?v=_YyW0DSCzpM;License: Standard Youtube License