Concept explainers
Videos
(a)
If the two sample t-procedures can be used to analyze the provided data for group differences.
(a)
Answer to Problem 71E
Solution: A t-test is appropriate to analyze the provided problem.
Explanation of Solution
Since, the population standard deviations are not known. It is replaced by sample standard deviations of the samples. Also, the sample sizes are almost equal in the provided problem, which is
(b)
The appropriate null and alternative hypotheses to compare the two groups in terms of consumption of fats.
(b)
Answer to Problem 71E
Solution: The null and alternative hypotheses are:
Explanation of Solution
Therefore, the hypotheses are formulated as:
In the above hypothesis,
(c)
To test: A significance test to determine the difference in consumption of fats in two groups.
(c)
Answer to Problem 71E
Solution: The t- test statistic is obtained as
Explanation of Solution
Calculation: To test the hypothesis formulated in part (b), the following test statistic is formulated,
Where,
The difference of means is considered as 0 according to the null hypothesis. Substitute the provided values in the above-defined formula to compute the two sample t-statistic. So,
The p-value for the provided one-sided test is calculated as
So, the degree of freedom is 199. Use Excel function to determine the exact p- value. The Excel function to determine the p- value from t-test statistic is mentioned below and the screenshot is attached,
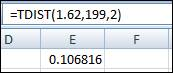
Therefore, the p-value is obtained as 0.1068.
To explain: A summary of the conclusion of the test performed above.
Answer to Problem 71E
Solution: The two groups of early eaters and late eaters have a similar average fat consumption.
Explanation of Solution
(d)
To find: A 95% confidence interval for the difference of means between early eaters and late eaters in terms of consumption of fats.
(d)
Answer to Problem 71E
Solution: The 95% confidence interval is
Explanation of Solution
Calculation: The confidence interval for the difference between the means is calculated as:
where
The t*–value for 95% confidence level is obtained as 1.97. Substitute the provided values in the above-defined formula to determine the 95% confidence interval as:
Therefore, the 95% confidence interval is obtained as
To explain: The comparison of information from obtained confidence interval with the information given by the significance test.
Answer to Problem 71E
Solution: Both the information obtained from confidence interval and the significance test shows that the null hypothesis is not rejected and concludes that there is no significant difference between the two means.
Explanation of Solution
The obtained confidence interval
Want to see more full solutions like this?
Chapter 7 Solutions
EBK INTRODUCTION TO THE PRACTICE OF STA


- Business Discussarrow_forwardThe following data represent total ventilation measured in liters of air per minute per square meter of body area for two independent (and randomly chosen) samples. Analyze these data using the appropriate non-parametric hypothesis testarrow_forwardeach column represents before & after measurements on the same individual. Analyze with the appropriate non-parametric hypothesis test for a paired design.arrow_forward
- Should you be confident in applying your regression equation to estimate the heart rate of a python at 35°C? Why or why not?arrow_forwardGiven your fitted regression line, what would be the residual for snake #5 (10 C)?arrow_forwardCalculate the 95% confidence interval around your estimate of r using Fisher’s z-transformation. In your final answer, make sure to back-transform to the original units.arrow_forward
 MATLAB: An Introduction with ApplicationsStatisticsISBN:9781119256830Author:Amos GilatPublisher:John Wiley & Sons Inc
 Probability and Statistics for Engineering and th...StatisticsISBN:9781305251809Author:Jay L. DevorePublisher:Cengage Learning
 Statistics for The Behavioral Sciences (MindTap C...StatisticsISBN:9781305504912Author:Frederick J Gravetter, Larry B. WallnauPublisher:Cengage Learning
 Elementary Statistics: Picturing the World (7th E...StatisticsISBN:9780134683416Author:Ron Larson, Betsy FarberPublisher:PEARSON
 The Basic Practice of StatisticsStatisticsISBN:9781319042578Author:David S. Moore, William I. Notz, Michael A. FlignerPublisher:W. H. Freeman
 Introduction to the Practice of StatisticsStatisticsISBN:9781319013387Author:David S. Moore, George P. McCabe, Bruce A. CraigPublisher:W. H. Freeman